OPEN-SOURCE SCRIPT
ADX/DMI Crossing/Delta Screener 3TF
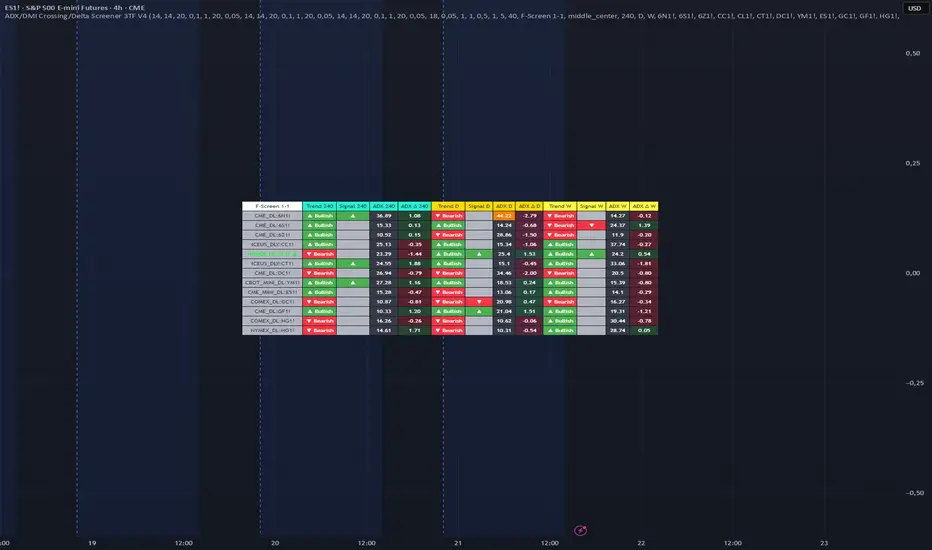
ADX/DMI Crossing/Delta Screener 3TF
13 Markets. 3 Timeframes. One Glance.
A colour-coded dashboard that reads trend strength (ADX) and trend direction (+DI/-DI) of up to 13 symbols on three freely selectable timeframes – live, on any chart. It shows at a glance which markets display signs of a starting trend, which ones are gaining strength and which ones are losing momentum.
━━ WHAT IS THE ADX? ━━
The Average Directional Index was developed by J. Welles Wilder (1978) and helps answer a key question: is this market trending or moving sideways? It is part of the DMI system:
• +DI / -DI – strength of upward / downward movement: WHERE the market is moving
• ADX – strength of the trend itself, regardless of direction: HOW STRONGLY it is moving
Common reading: below 20 weak or no trend, 20–25 and rising a trend may be forming, 25–40 established trend, above 40 very strong, possibly extended. Equally important is the slope: a rising ADX indicates a strengthening trend, a falling ADX indicates fading momentum.
━━ TIMEFRAMES ARE INTERLOCKED – THIS SCREENER KNOWS IT ━━
Markets move on all timeframes at once. Every weekly candle is built from daily candles, every daily candle from 4-hour candles. Timeframes interlock like the gears of a clock: when the small gear turns, the big one can follow – when the big gear stands still or turns the other way, it works against the small one. A 4h breakout against a strong weekly downtrend trades against higher-timeframe pressure; a breakout in line with a rising daily and weekly trend trades with it.
Most indicators show one timeframe only. This screener reads three interlocked timeframes simultaneously and shows them in one row per market, so you do not have to switch between 39 chart/timeframe combinations to get the same overview.
━━ KEY FEATURES ━━
• 13 symbols × 3 timeframes = 39 live trend readings in one table – stocks, forex, crypto, futures, indices
• More than "ADX above 20": rising ADX, ADX change, rise over n bars, ADX/DI crossings and DMI crossovers – each with its own colour
• Early trend phase detection ("Golden Crossing"): ADX breaking through a DI line from below at a low level with a minimum rise per bar – designed to highlight potential new trends early
• Strong vs. weak DMI crossovers: crossovers at a low ADX only count if the ADX is rising – intended to filter crossovers in quiet, sideways phases
• 2-TF DMI Cross: symbol cell is highlighted when a confirmed DMI crossover (strong, or weak with rising ADX) in the same direction occurs on at least two of the three timeframes within the lookback window ("Check DMI Cross over n Bars Back")
• Configurable Triple Signal (▲/▼ next to the symbol): you decide which timeframes must agree (AND), which are optional (OR) and where the ADX must rise
• Fading counter-trend logic: a falling ADX in the opposite trend direction can count as decreasing counter-pressure – the moment the big gear stops braking
• Orange ADX cell at the upper threshold (default 40) highlights potentially extended trends
• Works on any chart timeframe, movable table, custom title, all colours adjustable, tooltip on every setting
━━ WHAT MAKES IT ORIGINAL ━━
The ADX/DMI itself is a classic, public indicator (calculated with TradingView's built-in ta.dmi). The original part is how it is evaluated: rising/falling ADX filters with per-bar minimum deltas, early ADX/DI crossing detection, strong/weak DMI crossover classification, 2-timeframe crossover confluence and a configurable AND/OR/Rising-ADX triple logic across three timeframes and 13 symbols in one table. The combination serves one purpose: judging trend direction and trend strength across interlocked timeframes for a whole watchlist at once.
━━ READING THE TABLE ━━
Per timeframe:
• Trend – ▲ Bullish / ▼ Bearish (■ Neutral if +DI equals -DI). Green/Magenta: strong bullish/bearish DMI crossover. Turquoise/Orange: crossover below threshold, confirmed by rising ADX
• Signal – ▲/▼: ADX above threshold, rising, clear DI distance. Blue: ADX crossing event
• ADX – Orange: at/above upper threshold. Blue: ADX crossing below threshold (very early phase)
• ADX Δ – green = strength increasing, red = decreasing
Symbol column: green ▲ / red ▼ = Triple Signal long/short, purple ◆ = long and short at the same time (conflicting timeframes, only possible without AND boxes). Blue/Orange background = bullish/bearish 2-TF DMI Cross. Light blue = Triple Signal with ADX crossing.
━━ SETTINGS ━━
Timeframe 1/2/3 – each with its own parameters:
• DI Length / ADX Smoothing (14/14) – speed of DI lines and ADX
• ADX Threshold (20) – minimum ADX for a trend signal
• Min. ADX Delta (0.1) / ADX Rise over n Bars (1) – how much and how long the ADX must rise
• ADX Crossing Threshold (20) – ADX/DI crossings only count up to this level (early trends)
• Min. ADX Delta Falling (0.05) – minimum decline for "falling ADX" in the Triple Signal
ADX/DMI Crossing Parameters (all TFs):
• ADX Threshold for DMI Crossing (18) – separates strong from weak crossovers
• Min. ADX Delta / Rise over n Bars for DMI Crossing (0.05/1) – ADX rise required for weak crossovers
• Check DMI Cross over n Bars Back (1) – how long crossovers stay highlighted
• ADX Delta / Rise over n Bars for Golden Crossing (0.5/1) – ADX rise required for early-trend crossings
General & Table:
• Min. DI Diff. (5) – minimum +DI/-DI distance, filters undecided markets
• ADX Upper Threshold for Coloring (40) – marks potentially extended trends
• Symbol Column Title, Table Position, all colours
Timeframes: default 240 / D / W – any combination, e.g. 15/60/240 intraday or D/W/M for position trading.
Triple Signal Logic – how the ▲/▼ next to the symbol is built:
Step 1 – each timeframe can confirm a direction in two ways:
A) Rising trend: the Signal column shows ▲/▼ (ADX above threshold and rising with a clear DI distance, or an ADX crossing)
B) Fading counter-trend: the ADX is falling while the opposite side dominates – falling ADX in a bearish trend confirms LONG, in a bullish trend SHORT
Step 2 – the two checkboxes per timeframe:
• TFx Rising ADX – this timeframe may only confirm with A (B disabled)
• TFx: AND in Triple? – this timeframe becomes mandatory
Step 3 – how the timeframes are combined:
• No AND box (OR mode): one timeframe is enough, only A counts. If Rising ADX boxes are set, only those timeframes are checked; otherwise all three.
• With AND boxes: ALL AND timeframes must confirm the same direction (A or B, only A if Rising ADX is set). Timeframes without AND are ignored completely.
• ◆ instead of ▲/▼: long and short at the same time (only possible in OR mode, timeframes contradict each other).
Default: AND on Daily + Weekly, Rising ADX on Daily – "the daily trend gains strength while the weekly supports it or no longer works against it."
Examples (TF1 = 240, TF2 = D, TF3 = W):
1) Full confluence – AND + Rising ADX on TF1, TF2, TF3
All three Signal columns must show the same arrow. Strictest setup: few but strongly aligned signals.
2) Higher-timeframe filter (default) – AND on TF2 + TF3, Rising ADX on TF2
Daily Signal ▲ AND Weekly either ▲ or bearish with falling ADX. TF1 is ignored.
3) Entry timing – AND on TF1 + TF2, Rising ADX on TF1
4h trend gains strength, Daily supports it or its counter-trend fades. Weekly is ignored.
4) Reversal watch – AND on TF2 + TF3, no Rising ADX
Daily and Weekly may each confirm with a rising trend or a fading counter-trend – finds markets where the opposing higher-timeframe trend loses strength.
5) Single higher timeframe – AND on TF3 only
Only the Weekly decides: rising trend or fading counter-trend.
6) Early-entry scanner – Rising ADX on TF1 only, no AND
Every ▲/▼ in the 4h Signal column is shown.
7) Momentum overview – no checkbox at all
▲/▼ as soon as any Signal column shows an arrow; ◆ if timeframes point in opposite directions.
Symbols 1–13: any TradingView symbol. Default: 6N1!, 6S1!, 6Z1!, CC1!, CL1!, CT1!, DC1!, YM1!, ES1!, GC1!, GF1!, HG1!, HO1!
━━ LIMITATIONS ━━
• Real-time snapshot: the table shows the current state only – no historical signals, no plots, no alerts, no backtest.
• Timeframes higher than the chart use the current, still open bar. Values and signals can change or disappear until that bar closes.
• Timeframes lower than the chart show the last sub-bar of the current chart bar.
• 13 symbols × 3 timeframes use 39 data requests; loading can take a moment, more symbols are not possible.
• Futures: the screener calculates the ADX on continuous futures data (e.g. ES1!) without back-adjustment and without settlement price as close. Values can therefore differ from a chart with "B-ADJ" or "Use settlement as close" enabled, and roll gaps between contracts can briefly distort the ADX.
━━ WHO IS IT FOR? ━━
Futures, swing, position, intraday and options traders who want a broad watchlist and higher-timeframe context in one clear dashboard. The screener shows where to look, not what to do – combine it with your own entry, exit and risk rules.
Mã nguồn mở
Theo đúng tinh thần TradingView, tác giả của tập lệnh này đã công bố nó dưới dạng mã nguồn mở, để các nhà giao dịch có thể xem xét và xác minh chức năng. Chúc mừng tác giả! Mặc dù bạn có thể sử dụng miễn phí, hãy nhớ rằng việc công bố lại mã phải tuân theo Nội quy.

Thông báo miễn trừ trách nhiệm
Thông tin và các ấn phẩm này không nhằm mục đích, và không cấu thành, lời khuyên hoặc khuyến nghị về tài chính, đầu tư, giao dịch hay các loại khác do TradingView cung cấp hoặc xác nhận. Đọc thêm tại Điều khoản Sử dụng.
Mã nguồn mở
Theo đúng tinh thần TradingView, tác giả của tập lệnh này đã công bố nó dưới dạng mã nguồn mở, để các nhà giao dịch có thể xem xét và xác minh chức năng. Chúc mừng tác giả! Mặc dù bạn có thể sử dụng miễn phí, hãy nhớ rằng việc công bố lại mã phải tuân theo Nội quy.
Thông báo miễn trừ trách nhiệm
Thông tin và các ấn phẩm này không nhằm mục đích, và không cấu thành, lời khuyên hoặc khuyến nghị về tài chính, đầu tư, giao dịch hay các loại khác do TradingView cung cấp hoặc xác nhận. Đọc thêm tại Điều khoản Sử dụng.