Nambou Reclaim Radar
WHAT IT DOES
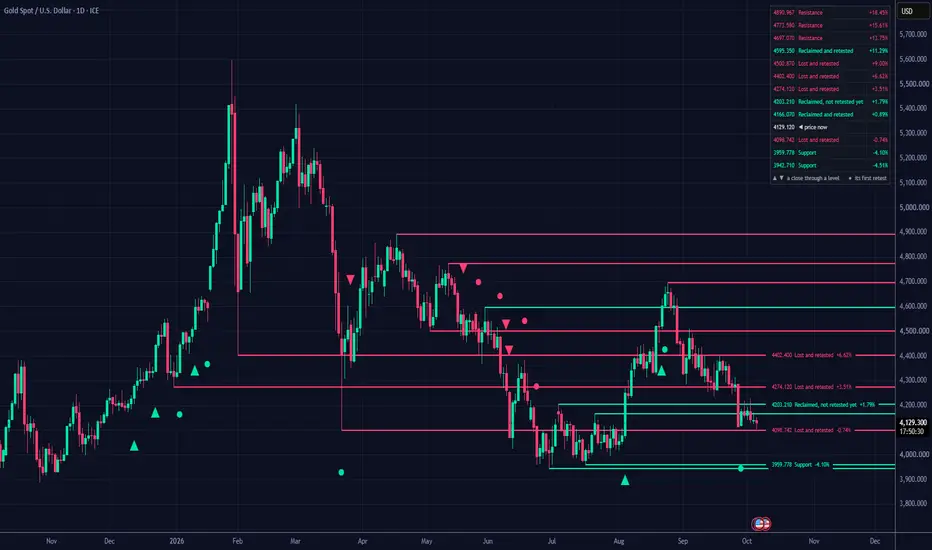
Reclaim Radar finds recent swing highs and lows, draws them as levels, and then watches what price does at each one.
When price closes back above an old swing high, that level counts as reclaimed and its line turns green. When price closes below an old swing low, the level is lost and its line turns red. After that, the indicator waits for the first retest: a bar that comes back to touch the level and still closes on the right side of it.
WHAT YOU SEE ON THE CHART
• A table of every level being tracked, highest at the top, showing whether each one is still resistance or support, has been reclaimed or lost, and whether it has been retested yet. It also shows how far each level is from the current price, with the price slotted in between them.
• Labels on the levels closest to price, so you can read the price, the status and the distance at a glance. If two labels would run into each other, one is dropped from the chart (it stays in the table), so the text never overlaps.
• Small markers on the candles: ▲ under a bar that closed back above a swing high, ▼ over a bar that closed below a swing low, and ● on the first retest.
HOW I USE IT
A level that flips and then holds on the retest is a natural place to build a trade around, because it tells you exactly where the idea stops being valid. The indicator only points these moments out. The entry, stop and target are your call.
SETTINGS
• Pivot left and Pivot right: how many bars on each side it takes to count as a swing. Higher numbers mean fewer, stronger levels.
• Max levels tracked per side: once there are more than this, the oldest ones drop off.
• How many levels to label on each side of price, and how much space to keep between labels.
• Table on or off, where it sits, and one text size for everything.
• Optional alerts for the flip and for the retest.
WORTH KNOWING
A swing is only confirmed once the "Pivot right" number of bars has passed, so new levels show up with that delay. Once a level is drawn, it stays put. Works on any symbol and any timeframe.
This is a charting tool, not financial advice, and it doesn't predict where price will go.
Reclaim Radar finds recent swing highs and lows, draws them as levels, and then watches what price does at each one.
When price closes back above an old swing high, that level counts as reclaimed and its line turns green. When price closes below an old swing low, the level is lost and its line turns red. After that, the indicator waits for the first retest: a bar that comes back to touch the level and still closes on the right side of it.
WHAT YOU SEE ON THE CHART
• A table of every level being tracked, highest at the top, showing whether each one is still resistance or support, has been reclaimed or lost, and whether it has been retested yet. It also shows how far each level is from the current price, with the price slotted in between them.
• Labels on the levels closest to price, so you can read the price, the status and the distance at a glance. If two labels would run into each other, one is dropped from the chart (it stays in the table), so the text never overlaps.
• Small markers on the candles: ▲ under a bar that closed back above a swing high, ▼ over a bar that closed below a swing low, and ● on the first retest.
HOW I USE IT
A level that flips and then holds on the retest is a natural place to build a trade around, because it tells you exactly where the idea stops being valid. The indicator only points these moments out. The entry, stop and target are your call.
SETTINGS
• Pivot left and Pivot right: how many bars on each side it takes to count as a swing. Higher numbers mean fewer, stronger levels.
• Max levels tracked per side: once there are more than this, the oldest ones drop off.
• How many levels to label on each side of price, and how much space to keep between labels.
• Table on or off, where it sits, and one text size for everything.
• Optional alerts for the flip and for the retest.
WORTH KNOWING
A swing is only confirmed once the "Pivot right" number of bars has passed, so new levels show up with that delay. Once a level is drawn, it stays put. Works on any symbol and any timeframe.
This is a charting tool, not financial advice, and it doesn't predict where price will go.

Trade smarter, not louder. Free signals 📈 lessons 🎓 market news 📰 👉 t.me/nambou_signals
Thông báo miễn trừ trách nhiệm
Thông tin và các ấn phẩm này không nhằm mục đích, và không cấu thành, lời khuyên hoặc khuyến nghị về tài chính, đầu tư, giao dịch hay các loại khác do TradingView cung cấp hoặc xác nhận. Đọc thêm tại Điều khoản Sử dụng.
Trade smarter, not louder. Free signals 📈 lessons 🎓 market news 📰 👉 t.me/nambou_signals
Thông báo miễn trừ trách nhiệm
Thông tin và các ấn phẩm này không nhằm mục đích, và không cấu thành, lời khuyên hoặc khuyến nghị về tài chính, đầu tư, giao dịch hay các loại khác do TradingView cung cấp hoặc xác nhận. Đọc thêm tại Điều khoản Sử dụng.