Relative Strength Line v1.3
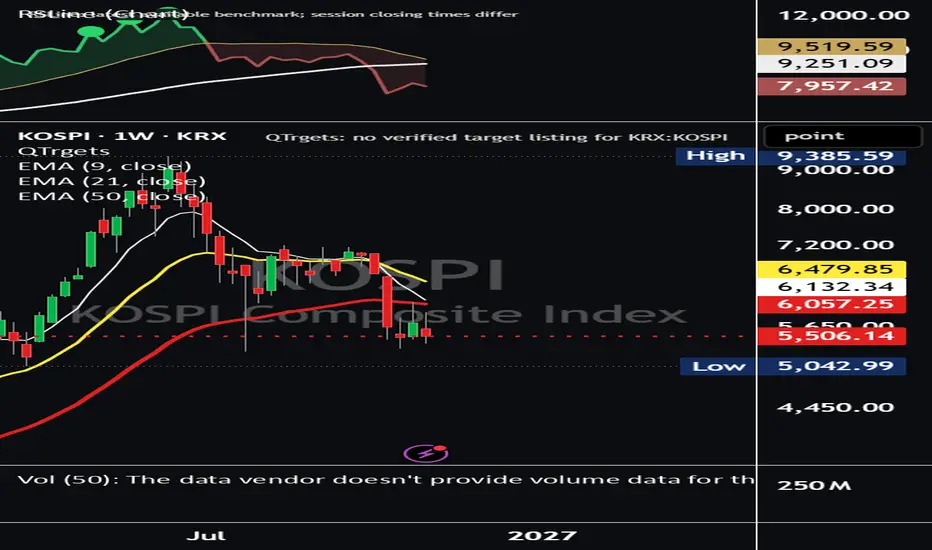
RSLine measures a stock’s performance relative to a chosen benchmark, with QQQ as the default. A rising line indicates outperformance; a falling line indicates underperformance.
Includes adjustable moving averages, green/red trend shading and new-high markers:
- **Green:** RS and price both exceed their previous lookback highs.
- **Purple:** RS exceeds its previous high while price has yet to exceed its own.
Calculate Daily, Weekly or Monthly RS independently of your chart timeframe. An optional table displays relative returns across multiple periods. Dots confirm after both the selected RS period and chart candle close.
Designed for standard Daily, Weekly and Monthly charts.
Includes adjustable moving averages, green/red trend shading and new-high markers:
- **Green:** RS and price both exceed their previous lookback highs.
- **Purple:** RS exceeds its previous high while price has yet to exceed its own.
Calculate Daily, Weekly or Monthly RS independently of your chart timeframe. An optional table displays relative returns across multiple periods. Dots confirm after both the selected RS period and chart candle close.
Designed for standard Daily, Weekly and Monthly charts.

@StocksMathPoker on X
1amInvesting.com
1amInvesting.com
Thông báo miễn trừ trách nhiệm
Thông tin và các ấn phẩm này không nhằm mục đích, và không cấu thành, lời khuyên hoặc khuyến nghị về tài chính, đầu tư, giao dịch hay các loại khác do TradingView cung cấp hoặc xác nhận. Đọc thêm tại Điều khoản Sử dụng.
@StocksMathPoker on X
1amInvesting.com
1amInvesting.com
Thông báo miễn trừ trách nhiệm
Thông tin và các ấn phẩm này không nhằm mục đích, và không cấu thành, lời khuyên hoặc khuyến nghị về tài chính, đầu tư, giao dịch hay các loại khác do TradingView cung cấp hoặc xác nhận. Đọc thêm tại Điều khoản Sử dụng.