OPEN-SOURCE SCRIPT
EonMetrics CISD
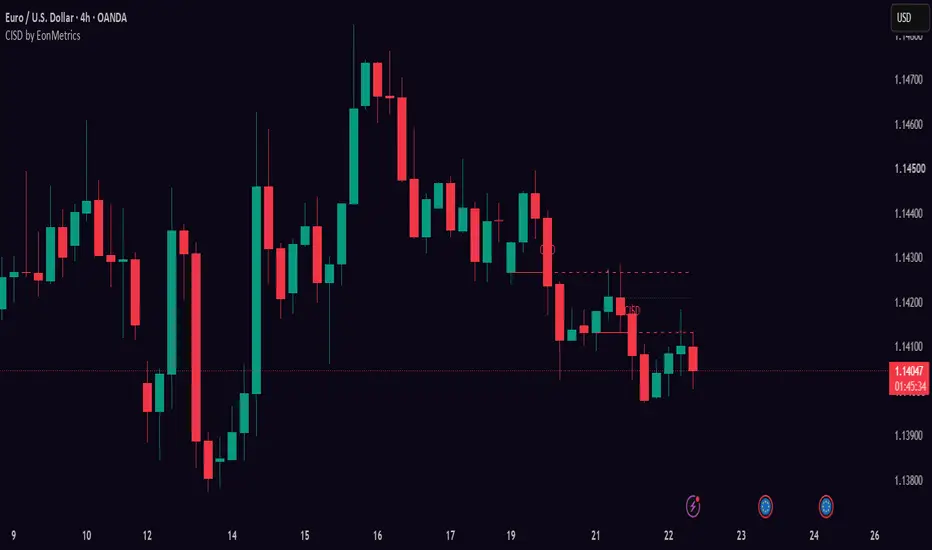
CISD — Change In State of Delivery
CISD marks the moment the market's delivery flips. Price is "delivered" in one direction through a series of consecutive same-direction candles; the open of the first candle of that series is the delivery level. When a later candle closes back through that level, the state of delivery has changed — that close is the CISD. The level is then kept on the chart and tracked as support or resistance, with retest and invalidation handling.

🔶HOW IT WORKS
The script counts consecutive same-direction candles (by candle body, by default). When such a series ends, the open of its FIRST candle is remembered as the delivery level, shown as a dotted pending line. When a later candle CLOSES through that level against the series direction, the CISD is confirmed — the level is drawn and tracked as support or resistance from that bar on.
🔶HOW CISD DIFFERS FROM MSS / BOS
Structure tools (MSS, BOS, CHoCH) need a swing pivot: a high or low must form and be confirmed by candles on both sides before a break of it means anything. CISD needs no pivot at all — the reference level comes straight from the candle series itself (the open of the first candle of the last delivery leg). That is why a CISD typically confirms earlier than a structure shift: the close through the series origin often prints several bars before the equivalent MSS. Earlier also means less filtered — CISD is a faster, more granular read of the same idea, not a replacement for structure.
🔶WHAT IT DOES
Series detection — counts consecutive same-direction candles (direction by candle body, or optionally close-vs-previous-close). A series qualifies as delivery once it reaches the minimum length you set. A doji can either ride the series or end it — your choice.
Pending level (dotted) — as soon as a qualifying series ends, the open of its first candle becomes the candidate level, drawn as a dotted line. This is where the next CISD would confirm. Nothing is signaled yet — the line just shows you what the market has to close through.
Confirmed CISD (solid) — when a candle closes through the pending level, the level turns solid, gets its CISD label, and starts being tracked: bullish CISD levels act as support, bearish as resistance.
Level lifecycle — an active level extends bar by bar. When price fully leaves it and later returns to touch it, that touch is marked as a retest (wick-based). When a candle closes back through the level, it is invalidated — removed, or kept dimmed on the chart if you prefer to study failures. An optional lifetime cap quietly expires old levels.
Current delivery state — an optional floating label shows the running series direction and its candle count (e.g. "Bearish x4").

🔶NON-REPAINTING
The entire engine advances on confirmed bars only. Nothing is drawn, moved or deleted intrabar: a pending level appears only after its series is complete, a CISD confirms only on a closed candle, and retests/breaks are evaluated on closed candles. What you see on a historical chart is exactly what you would have seen live.
🔶ALERTS
Six alert conditions: bullish/bearish CISD confirmed, bullish/bearish level retested, bullish/bearish level broken.
🔶HOW TO USE
1. Keep Min Series Length at 2 for a responsive read, raise to 3-4 to only mark the strongest delivery legs.
2. Watch the dotted pending line — it tells you in advance which level a close has to take out for delivery to flip.
3. After a confirmed CISD, the level itself is the tradeable information: bullish CISD levels tend to act as support on the retest, bearish as resistance.
4. Set alerts on confirmations and retests instead of watching the chart.
🔶SETTINGS
Detection (min series length, candle direction mode, doji handling) · Levels (max active per side, lifetime, keep broken, retest markers, pending line) · Style (colors, line width, label size, delivery-state label).
This tool annotates delivery levels. It does not predict direction, does not generate entries and has no targets — what you do at a level is your decision.
Part of the EonMetrics toolset.
CISD marks the moment the market's delivery flips. Price is "delivered" in one direction through a series of consecutive same-direction candles; the open of the first candle of that series is the delivery level. When a later candle closes back through that level, the state of delivery has changed — that close is the CISD. The level is then kept on the chart and tracked as support or resistance, with retest and invalidation handling.
🔶HOW IT WORKS
The script counts consecutive same-direction candles (by candle body, by default). When such a series ends, the open of its FIRST candle is remembered as the delivery level, shown as a dotted pending line. When a later candle CLOSES through that level against the series direction, the CISD is confirmed — the level is drawn and tracked as support or resistance from that bar on.
🔶HOW CISD DIFFERS FROM MSS / BOS
Structure tools (MSS, BOS, CHoCH) need a swing pivot: a high or low must form and be confirmed by candles on both sides before a break of it means anything. CISD needs no pivot at all — the reference level comes straight from the candle series itself (the open of the first candle of the last delivery leg). That is why a CISD typically confirms earlier than a structure shift: the close through the series origin often prints several bars before the equivalent MSS. Earlier also means less filtered — CISD is a faster, more granular read of the same idea, not a replacement for structure.
🔶WHAT IT DOES
Series detection — counts consecutive same-direction candles (direction by candle body, or optionally close-vs-previous-close). A series qualifies as delivery once it reaches the minimum length you set. A doji can either ride the series or end it — your choice.
Pending level (dotted) — as soon as a qualifying series ends, the open of its first candle becomes the candidate level, drawn as a dotted line. This is where the next CISD would confirm. Nothing is signaled yet — the line just shows you what the market has to close through.
Confirmed CISD (solid) — when a candle closes through the pending level, the level turns solid, gets its CISD label, and starts being tracked: bullish CISD levels act as support, bearish as resistance.
Level lifecycle — an active level extends bar by bar. When price fully leaves it and later returns to touch it, that touch is marked as a retest (wick-based). When a candle closes back through the level, it is invalidated — removed, or kept dimmed on the chart if you prefer to study failures. An optional lifetime cap quietly expires old levels.
Current delivery state — an optional floating label shows the running series direction and its candle count (e.g. "Bearish x4").
🔶NON-REPAINTING
The entire engine advances on confirmed bars only. Nothing is drawn, moved or deleted intrabar: a pending level appears only after its series is complete, a CISD confirms only on a closed candle, and retests/breaks are evaluated on closed candles. What you see on a historical chart is exactly what you would have seen live.
🔶ALERTS
Six alert conditions: bullish/bearish CISD confirmed, bullish/bearish level retested, bullish/bearish level broken.
🔶HOW TO USE
1. Keep Min Series Length at 2 for a responsive read, raise to 3-4 to only mark the strongest delivery legs.
2. Watch the dotted pending line — it tells you in advance which level a close has to take out for delivery to flip.
3. After a confirmed CISD, the level itself is the tradeable information: bullish CISD levels tend to act as support on the retest, bearish as resistance.
4. Set alerts on confirmations and retests instead of watching the chart.
🔶SETTINGS
Detection (min series length, candle direction mode, doji handling) · Levels (max active per side, lifetime, keep broken, retest markers, pending line) · Style (colors, line width, label size, delivery-state label).
This tool annotates delivery levels. It does not predict direction, does not generate entries and has no targets — what you do at a level is your decision.
Part of the EonMetrics toolset.
Mã nguồn mở
Theo đúng tinh thần TradingView, tác giả của tập lệnh này đã công bố nó dưới dạng mã nguồn mở, để các nhà giao dịch có thể xem xét và xác minh chức năng. Chúc mừng tác giả! Mặc dù bạn có thể sử dụng miễn phí, hãy nhớ rằng việc công bố lại mã phải tuân theo Nội quy.

Thông báo miễn trừ trách nhiệm
Thông tin và các ấn phẩm này không nhằm mục đích, và không cấu thành, lời khuyên hoặc khuyến nghị về tài chính, đầu tư, giao dịch hay các loại khác do TradingView cung cấp hoặc xác nhận. Đọc thêm tại Điều khoản Sử dụng.
Mã nguồn mở
Theo đúng tinh thần TradingView, tác giả của tập lệnh này đã công bố nó dưới dạng mã nguồn mở, để các nhà giao dịch có thể xem xét và xác minh chức năng. Chúc mừng tác giả! Mặc dù bạn có thể sử dụng miễn phí, hãy nhớ rằng việc công bố lại mã phải tuân theo Nội quy.
Thông báo miễn trừ trách nhiệm
Thông tin và các ấn phẩm này không nhằm mục đích, và không cấu thành, lời khuyên hoặc khuyến nghị về tài chính, đầu tư, giao dịch hay các loại khác do TradingView cung cấp hoặc xác nhận. Đọc thêm tại Điều khoản Sử dụng.