Cập nhật
[blackcat] L1 Markos Katsanos Volume Flow Indicator
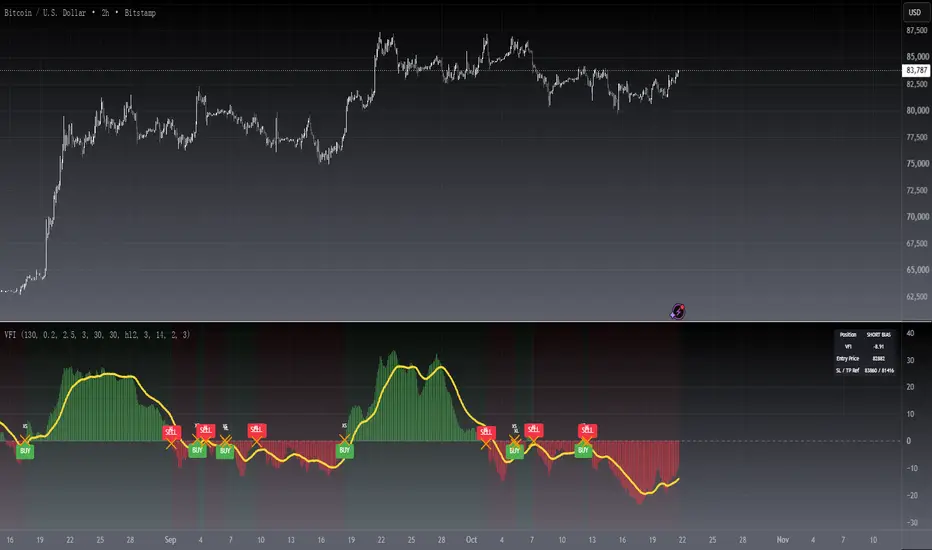
Level 1
Background
Markos Katsanos’ volume flow indicator (VFI) calculation uses a default period of 130 days for daily charts. As a result, when applying the strategy, you will need to set the maximum number of bars the study will reference in the general tab of properties for all to at least 130. In order to compare the system objectively with the buy & hold results, he specified a trade size as a percent of equity.
Function
For more information see Markos Katsanos's articles in the June 2004 and July 2004 issues of Technical Analysis of Stocks & Commodities magazine. Period=days for VFI calculation. Default values are 130 for daily and 26 for weekly charts.Coef=coefficient for minimal price cut-of (use 0.2 for daily and 0.1 for intraday 5-15 min data) Vcoef=coefficient for volume cut-off (use 2.5 for daily and 3.5 for intraday charts)
Remarks
This is a Level 1 free and open source indicator.
Feedbacks are appreciated.
Background
Markos Katsanos’ volume flow indicator (VFI) calculation uses a default period of 130 days for daily charts. As a result, when applying the strategy, you will need to set the maximum number of bars the study will reference in the general tab of properties for all to at least 130. In order to compare the system objectively with the buy & hold results, he specified a trade size as a percent of equity.
Function
For more information see Markos Katsanos's articles in the June 2004 and July 2004 issues of Technical Analysis of Stocks & Commodities magazine. Period=days for VFI calculation. Default values are 130 for daily and 26 for weekly charts.Coef=coefficient for minimal price cut-of (use 0.2 for daily and 0.1 for intraday 5-15 min data) Vcoef=coefficient for volume cut-off (use 2.5 for daily and 3.5 for intraday charts)
Remarks
This is a Level 1 free and open source indicator.
Feedbacks are appreciated.
Phát hành các Ghi chú
OVERVIEWThe [blackcat] L1 Markos Katsanos Volume Flow Indicator (VFI) helps traders analyze market momentum by combining price action and volume data. This script calculates the VFI using customizable parameters and plots it on a separate pane, providing insights into buying and selling pressure. It also generates alerts and labels for potential trade signals, making it a valuable tool for identifying trends and reversals 📊💹.
FEATURES
Calculates the Markos Katsanos Volume Flow Indicator using user-defined parameters.
Plots the VFI on a separate pane with dynamic coloring:
Green bars indicate bullish momentum.
Red bars indicate bearish momentum.
Includes a zero line for reference and an exponential moving average (EMA) of the VFI.
Generates buy and sell signals based on VFI crossovers and crossunders 🚀📉
Adds visual labels for easy identification of trade signals:
"BUY" labeled in green during bullish crossovers.
"SELL" labeled in red during bearish crossunders.
Provides alert conditions for both buy and sell signals 🔔
HOW TO USE
Add the indicator to your TradingView chart by selecting it from the indicators list.
Observe the VFI plot in the separate pane for changes in momentum.
Monitor the buy ('BUY') and sell ('SELL') labels for potential trade opportunities.
Set up alerts based on the generated signals to receive notifications when conditions are met 📲.
Combine this indicator with other tools for confirmation before executing trades.
INPUT PARAMETERS
Periods: Define the lookback period for calculating averages (default is 130).
Coefficient: Adjust the sensitivity of the indicator (default is 0.2).
Volume Coefficient: Control the impact of volume on the calculation (default is 2.5).
Smoothing Periods: Specify the number of periods for smoothing the VFI (default is 3).
Moving Average Period: Determine the period for the EMA of the VFI (default is 30).
Typical Price: Select the price source for calculations (default is HL2).
LIMITATIONS
The indicator may generate false signals in low-volume or choppy markets 🌪️.
Users should always confirm signals with other forms of analysis.
Customization of parameters might be required for different market conditions.
NOTES
Ensure that you have sufficient historical data available for accurate calculations.
Test the indicator thoroughly on demo accounts before applying it to live trading 🔍.
Experiment with different parameter settings to optimize performance for specific assets or timeframes.
Phát hành các Ghi chú
█ OVERVIEWThe Volume Flow Indicator (VFI), developed by Markos Katsanos, measures the strength of money flowing in and out of a security by weighing volume with directional price movement. This polished version adds a position-state machine, a signal cooldown, ATR-based stop-loss/take-profit reference levels, a status dashboard and full alert coverage, while keeping the original VFI calculation untouched.
█ CONCEPTS
The VFI accumulates directional volume over a rolling window:
• Only price moves larger than a volatility-based cutoff count as directional; smaller moves are treated as noise.
• Each bar's volume is capped at a multiple of average volume, so one abnormal bar cannot dominate the flow.
• The summed directional volume is normalized by average volume and optionally smoothed with an EMA.
• A VFI above zero indicates accumulation; below zero indicates distribution. Rising magnitude confirms trend strength.
█ HOW TO USE
1 — Add the indicator to your chart; it runs in a separate pane below price.
2 — Read the columns against the zero line: green columns above zero mean positive volume flow.
3 — BUY/SELL labels mark VFI zero-line crosses, governed by a state machine with an adjustable cooldown.
4 — Use the yellow MA line for trend context and the background tint for the current bias direction.
5 — Create alerts from the script's alert list: long entry, short entry, long exit, short exit.
Input Parameters
• Periods (130): window for the volume flow sum and average volume.
• Coefficient (0.2): cutoff multiplier; higher values demand bigger price moves to count as flow.
• Volume Coefficient (2.5): caps single-bar volume at this multiple of average volume.
• Smoothing Periods (3): EMA smoothing of raw VFI; 0 disables smoothing.
• Moving Average Period (30): EMA length of the signal MA line.
• Volatility Window (30): standard-deviation window behind the cutoff.
• Typical Price (hl2): source used for directional price changes.
• Cooldown Bars (3): minimum bars between state changes; 0 disables.
• Risk group: ATR-based references (ATR 14, SL 2.0 xATR, TP 3.0 xATR) for the latest signal.
• Visuals: column color mode, background, labels and dashboard toggles.
█ FEATURES
• Original Katsanos VFI calculation, preserved line by line.
• State-machine signal governance with cooldown that suppresses whipsaw around the zero line.
• ATR-based stop-loss and take-profit reference prices shown in the dashboard and data window.
• Position-state background tinting: green for long bias, red for short bias.
• Four alertcondition events plus dynamic bar-close alerts that include price context.
█ SIGNALS
• BUY label (green, up arrow): VFI crossed above zero, long bias begins.
• SELL label (red, down arrow): VFI crossed below zero, short bias begins.
• XL / XS labels (orange cross): long / short bias ended by the opposite cross.
• Dashboard: current bias, VFI value, last entry price and SL/TP reference levels.
█ LIMITATIONS
• Requires meaningful volume data; not suitable for symbols without real volume.
• Signals lag by design because of the long window; originally tuned for daily charts.
• Whipsaw can still occur in flat, range-bound markets even with the cooldown enabled.
• TP/SL values are informational references for the latest signal, not automated orders.
█ NOTES
• Original VFI concept by Markos Katsanos, Technical Analysis of Stocks and Commodities.
• Pine Script v6, open source. Educational tool; not financial advice. Test before trading live.
════════════════════════════════════════════════════════════════════════
For questions or feedback, please use the comments section below.
Feel free to use and modify — attribution appreciated.

Don't miss out! The first and most important thing to do is to join my Discord chat now! Click here to start your adventure: discord.com/invite/ZTGpQJq My new github for more pine development soon: github.com/wxt-coder
Thông báo miễn trừ trách nhiệm
Thông tin và các ấn phẩm này không nhằm mục đích, và không cấu thành, lời khuyên hoặc khuyến nghị về tài chính, đầu tư, giao dịch hay các loại khác do TradingView cung cấp hoặc xác nhận. Đọc thêm tại Điều khoản Sử dụng.
Don't miss out! The first and most important thing to do is to join my Discord chat now! Click here to start your adventure: discord.com/invite/ZTGpQJq My new github for more pine development soon: github.com/wxt-coder
Thông báo miễn trừ trách nhiệm
Thông tin và các ấn phẩm này không nhằm mục đích, và không cấu thành, lời khuyên hoặc khuyến nghị về tài chính, đầu tư, giao dịch hay các loại khác do TradingView cung cấp hoặc xác nhận. Đọc thêm tại Điều khoản Sử dụng.