OPEN-SOURCE SCRIPT
MTF LIVE SMA Heatmap
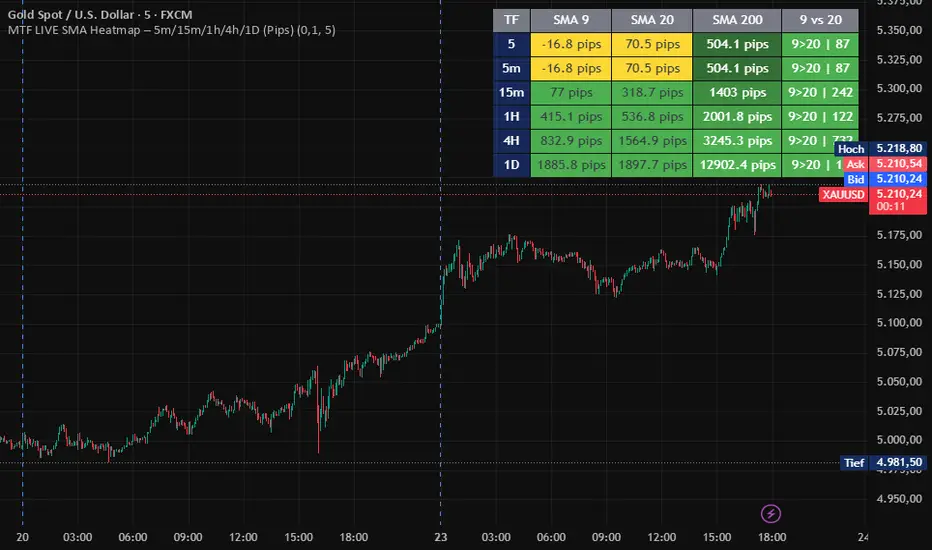
This tool displays a multi‑timeframe heatmap for SMA 9, SMA 20, and SMA 200.
It combines trend direction, pip distance, and market structure in a compact table.
Features
Pip distance between price and SMA (automatically calculated for each symbol)
Yellow highlight when price is between SMA 9 and SMA 20
Green when price is above both SMAs
Red when price is below both SMAs
SMA‑200 heatmap based on percentage distance (with neutral zone)
Trend comparison 9 vs 20 (9>20, 20>9, or neutral)
Additional row for the current timeframe
Supports Forex, Gold, Silver, Indices, Crypto, and Energies
Pip Engine
A universal pip engine automatically detects the correct pip size for each symbol
(e.g., XAU = 0.10, XAG = 0.01, BTC = 1.0, EURUSD = 0.0001, etc.).
Use Cases
Perfect for:
Trend filtering
Multi‑TF confirmation
Scalping / intraday trading
Identifying transition zones (yellow area)
SMA cluster analysis
9to20 Pip Distance
It combines trend direction, pip distance, and market structure in a compact table.
Features
Pip distance between price and SMA (automatically calculated for each symbol)
Yellow highlight when price is between SMA 9 and SMA 20
Green when price is above both SMAs
Red when price is below both SMAs
SMA‑200 heatmap based on percentage distance (with neutral zone)
Trend comparison 9 vs 20 (9>20, 20>9, or neutral)
Additional row for the current timeframe
Supports Forex, Gold, Silver, Indices, Crypto, and Energies
Pip Engine
A universal pip engine automatically detects the correct pip size for each symbol
(e.g., XAU = 0.10, XAG = 0.01, BTC = 1.0, EURUSD = 0.0001, etc.).
Use Cases
Perfect for:
Trend filtering
Multi‑TF confirmation
Scalping / intraday trading
Identifying transition zones (yellow area)
SMA cluster analysis
9to20 Pip Distance
Mã nguồn mở
Theo đúng tinh thần TradingView, tác giả của tập lệnh này đã công bố nó dưới dạng mã nguồn mở, để các nhà giao dịch có thể xem xét và xác minh chức năng. Chúc mừng tác giả! Mặc dù bạn có thể sử dụng miễn phí, hãy nhớ rằng việc công bố lại mã phải tuân theo Nội quy.

Thông báo miễn trừ trách nhiệm
Thông tin và các ấn phẩm này không nhằm mục đích, và không cấu thành, lời khuyên hoặc khuyến nghị về tài chính, đầu tư, giao dịch hay các loại khác do TradingView cung cấp hoặc xác nhận. Đọc thêm tại Điều khoản Sử dụng.
Mã nguồn mở
Theo đúng tinh thần TradingView, tác giả của tập lệnh này đã công bố nó dưới dạng mã nguồn mở, để các nhà giao dịch có thể xem xét và xác minh chức năng. Chúc mừng tác giả! Mặc dù bạn có thể sử dụng miễn phí, hãy nhớ rằng việc công bố lại mã phải tuân theo Nội quy.
Thông báo miễn trừ trách nhiệm
Thông tin và các ấn phẩm này không nhằm mục đích, và không cấu thành, lời khuyên hoặc khuyến nghị về tài chính, đầu tư, giao dịch hay các loại khác do TradingView cung cấp hoặc xác nhận. Đọc thêm tại Điều khoản Sử dụng.