OPEN-SOURCE SCRIPT
Random Forest AI - RSI MACD Confluence [Dots3Red]
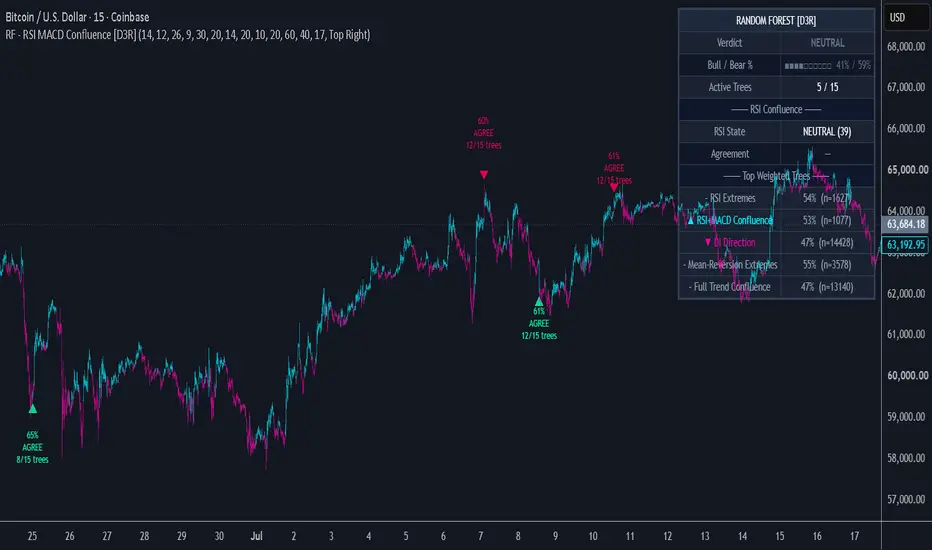
█ RANDOM FOREST AI — RSI MACD CONFLUENCE [Dots3Red]
This script combines 15 simple, independent decision rules ("trees") into one weighted verdict. Each tree looks at a different combination of RSI, MACD, ATR, volume, DMI, and price-vs-moving-average conditions and casts one vote: bullish, bearish, or neutral. What makes this different from simply averaging several indicators is that every tree's historical accuracy is tracked continuously, and that accuracy becomes the tree's voting weight — a rule that has actually been right more often on this specific chart counts for more than one that hasn't.
█ WHY THIS APPROACH
A single indicator like RSI applies the same fixed rule forever: "below 30 means buy," regardless of whether that rule has been working lately on the instrument you're watching. It has no way to notice that its own signal has become less reliable in a strong trend, or more reliable during a ranging period.
This script addresses that by running many small, simple rules in parallel and grading each one against what actually happened afterward. A rule's influence on the final verdict rises when it's been accurate and falls when it hasn't — without requiring the trader to manually decide which indicator to trust in current conditions.
This is a simplified, Pine-native ensemble. A literal machine-learning Random Forest trains via recursive data-splitting across bootstrap-sampled datasets, which isn't something Pine Script's execution model supports. What's implemented here captures the core idea in a form that runs natively on every bar: multiple diverse, simple voters, weighted by empirical track record rather than by a fixed formula.
█ HOW IT WORKS
1. Base features
Six indicators are computed every bar and feed into the trees:
• RSI (configurable length)
• MACD histogram
• ATR ratio — current ATR relative to a 50-bar baseline (volatility context)
• Volume ratio — current volume relative to its moving average
• DI difference — +DI minus -DI from the DMI system (directional pressure)
• Price vs. moving average — distance from a trend MA, expressed in ATR units
2. The 15 trees
Each tree is a short, explicit rule combining two or three of the base features. They are deliberately varied in character:
• Some are trend-following (DI direction, MACD momentum, full trend confluence combining three features at once)
• Some are contrarian / mean-reversion (an extreme price extension combined with an extreme RSI reading votes for a pullback, not a continuation)
• Some are volatility-filtered (an RSI extreme only counts when the ATR ratio shows calm conditions, on the reasoning that overbought/oversold readings are less reliable during high volatility)
• Some require multi-indicator confluence before voting at all (MACD direction agreeing with volume expansion, or RSI agreeing with MACD)
Any single tree by itself is simplistic. The value comes from having 15 of them looking at the situation from different angles simultaneously.
3. Historical grading and weighting
Every tree's vote from a configurable number of bars ago ("Outcome Window") is compared against what price actually did between then and now. If the tree voted bullish and price rose, that's a correct call; if it voted bullish and price fell, that's incorrect. A running hit/total count is kept per tree.
Each tree's weight is its accuracy rate (hits ÷ total) once it has accumulated a minimum number of graded votes. Before that minimum is reached, a tree counts at a neutral 0.5 weight so early, unproven trees don't disproportionately swing the verdict.
4. The forest verdict
Bullish and bearish contributions are summed across all 15 trees, weighted by each tree's current accuracy, then expressed as a percentage split (e.g. 73% bullish / 27% bearish). The overall verdict — BULLISH, BEARISH, or NEUTRAL — is determined by configurable thresholds (default: 60% for bullish, below 40% bullish-share for bearish).
5. RSI confluence
Separately from its role inside the 15 trees, RSI's classic overbought/oversold state is checked against the forest's overall verdict. If RSI is oversold and the forest is bullish, that's flagged as "AGREE." If RSI is oversold but the forest is bearish, that's flagged as "CONFLICT." This gives a second, independent read using the indicator most traders already know, alongside the ensemble's own conclusion.
█ SIGNAL MARKERS AND SPACING
A marker appears only when three conditions line up at once: the forest's weighted verdict crosses its threshold, RSI's classic overbought/oversold state independently agrees with that direction, and the bar has fully closed. Markers never appear on a still-forming bar — the script waits for bar confirmation so a marker never appears and then vanishes as the live bar changes.
Each marker is drawn in two parts: a small triangle at the bar, and a text block showing three values — the weighted percentage that triggered it, the word AGREE confirming RSI's independent agreement, and how many of the 15 trees were actively voting (non-neutral) at that moment. A reading of "73% / AGREE / 9/15 trees" carries different weight than "61% / AGREE / 4/15 trees," even though both pass the threshold — the first reflects broad participation across the ensemble, the second a thin majority among few active voters.
Two mechanisms prevent marker clutter on intraday timeframes:
• One marker per episode — when the verdict enters a bullish or bearish state, only the first qualifying signal of that run is marked. The verdict flickering around the threshold (61% → 59% → 62%) does not produce repeated markers; the internal latch resets only when the verdict genuinely changes state.
• Signal Cooldown — a configurable minimum number of bars between same-side markers, which absorbs the remaining case where a brief state change resets the latch and the condition re-triggers shortly after. On a 5-minute chart, a cooldown of 30 bars means at least 2.5 hours between same-direction markers.
Both mechanisms apply per direction — a bearish marker shortly after a bullish one is never suppressed, because an ensemble flip is meaningful information rather than clutter.
█ READING THE CHART
Bar coloring tints candles by the current verdict — cyan for bullish, magenta for bearish, slate for neutral.
Dashboard (top-right by default) shows the current verdict, the bull/bear percentage split with a progress bar, how many trees are actively voting, RSI's state and its agreement with the verdict, and a breakdown of five representative trees showing each one's live weight and how many samples that weight is based on.
█ SETTINGS
Feature Settings — lengths for RSI, MACD, ATR baseline, volume MA, DMI, and the trend MA used by the price-vs-MA feature.
Ensemble Settings
• Outcome Window (bars) — how far ahead each vote is checked against actual price movement
• Min Samples Before Weighting — how many graded votes a tree needs before its real accuracy replaces the neutral 0.5 default
• Bullish / Bearish Threshold % — where the weighted percentage split has to cross before the verdict label changes
Visualization
• Color Bars by Verdict — toggle candle tinting
• Show Confluence Markers — toggle the triangle markers
• Signal Cooldown (bars) — minimum bars between same-side markers; raise this on lower timeframes if markers feel too frequent
Dashboard — toggle the table, choose its position, toggle the per-tree accuracy breakdown.
█ EXAMPLE
Suppose the dashboard shows: Verdict BULLISH, 73% / 27%, 9/15 trees active, RSI at 28 (OVERSOLD), Agreement: AGREE. This means the weighted vote across all 15 trees currently favors upside by roughly 3-to-1, nine of the trees have a non-neutral opinion right now, and the classic RSI reading independently supports the same bullish read. If the per-tree breakdown shows "Calm-Market RSI" at 78% (n=45) while "RSI Extremes" sits at 52% (n=45), that's telling you the version of the RSI rule that only fires during low volatility has actually been considerably more reliable on this chart than the raw, unfiltered version — information a plain RSI plot could never surface on its own.

█ NOTES
Weights start neutral and only become meaningful once each tree has accumulated enough graded votes (set by "Min Samples Before Weighting"). On a fresh chart or a newly added timeframe, expect the dashboard's percentages to be less informative until that history builds up. The ensemble adapts continuously — a tree's weight can and will drift as market conditions change and its track record evolves.
On intraday timeframes, tune the Signal Cooldown to the chart's pace. The default suits higher timeframes; 5-minute and 15-minute charts generally benefit from a larger value.
█ DISCLAIMER
This is an analytical and visualization tool. It does not generate trade signals and does not constitute financial advice. Historical accuracy of any individual rule or the ensemble as a whole does not guarantee future performance.
This script combines 15 simple, independent decision rules ("trees") into one weighted verdict. Each tree looks at a different combination of RSI, MACD, ATR, volume, DMI, and price-vs-moving-average conditions and casts one vote: bullish, bearish, or neutral. What makes this different from simply averaging several indicators is that every tree's historical accuracy is tracked continuously, and that accuracy becomes the tree's voting weight — a rule that has actually been right more often on this specific chart counts for more than one that hasn't.
█ WHY THIS APPROACH
A single indicator like RSI applies the same fixed rule forever: "below 30 means buy," regardless of whether that rule has been working lately on the instrument you're watching. It has no way to notice that its own signal has become less reliable in a strong trend, or more reliable during a ranging period.
This script addresses that by running many small, simple rules in parallel and grading each one against what actually happened afterward. A rule's influence on the final verdict rises when it's been accurate and falls when it hasn't — without requiring the trader to manually decide which indicator to trust in current conditions.
This is a simplified, Pine-native ensemble. A literal machine-learning Random Forest trains via recursive data-splitting across bootstrap-sampled datasets, which isn't something Pine Script's execution model supports. What's implemented here captures the core idea in a form that runs natively on every bar: multiple diverse, simple voters, weighted by empirical track record rather than by a fixed formula.
█ HOW IT WORKS
1. Base features
Six indicators are computed every bar and feed into the trees:
• RSI (configurable length)
• MACD histogram
• ATR ratio — current ATR relative to a 50-bar baseline (volatility context)
• Volume ratio — current volume relative to its moving average
• DI difference — +DI minus -DI from the DMI system (directional pressure)
• Price vs. moving average — distance from a trend MA, expressed in ATR units
2. The 15 trees
Each tree is a short, explicit rule combining two or three of the base features. They are deliberately varied in character:
• Some are trend-following (DI direction, MACD momentum, full trend confluence combining three features at once)
• Some are contrarian / mean-reversion (an extreme price extension combined with an extreme RSI reading votes for a pullback, not a continuation)
• Some are volatility-filtered (an RSI extreme only counts when the ATR ratio shows calm conditions, on the reasoning that overbought/oversold readings are less reliable during high volatility)
• Some require multi-indicator confluence before voting at all (MACD direction agreeing with volume expansion, or RSI agreeing with MACD)
Any single tree by itself is simplistic. The value comes from having 15 of them looking at the situation from different angles simultaneously.
3. Historical grading and weighting
Every tree's vote from a configurable number of bars ago ("Outcome Window") is compared against what price actually did between then and now. If the tree voted bullish and price rose, that's a correct call; if it voted bullish and price fell, that's incorrect. A running hit/total count is kept per tree.
Each tree's weight is its accuracy rate (hits ÷ total) once it has accumulated a minimum number of graded votes. Before that minimum is reached, a tree counts at a neutral 0.5 weight so early, unproven trees don't disproportionately swing the verdict.
4. The forest verdict
Bullish and bearish contributions are summed across all 15 trees, weighted by each tree's current accuracy, then expressed as a percentage split (e.g. 73% bullish / 27% bearish). The overall verdict — BULLISH, BEARISH, or NEUTRAL — is determined by configurable thresholds (default: 60% for bullish, below 40% bullish-share for bearish).
5. RSI confluence
Separately from its role inside the 15 trees, RSI's classic overbought/oversold state is checked against the forest's overall verdict. If RSI is oversold and the forest is bullish, that's flagged as "AGREE." If RSI is oversold but the forest is bearish, that's flagged as "CONFLICT." This gives a second, independent read using the indicator most traders already know, alongside the ensemble's own conclusion.
█ SIGNAL MARKERS AND SPACING
A marker appears only when three conditions line up at once: the forest's weighted verdict crosses its threshold, RSI's classic overbought/oversold state independently agrees with that direction, and the bar has fully closed. Markers never appear on a still-forming bar — the script waits for bar confirmation so a marker never appears and then vanishes as the live bar changes.
Each marker is drawn in two parts: a small triangle at the bar, and a text block showing three values — the weighted percentage that triggered it, the word AGREE confirming RSI's independent agreement, and how many of the 15 trees were actively voting (non-neutral) at that moment. A reading of "73% / AGREE / 9/15 trees" carries different weight than "61% / AGREE / 4/15 trees," even though both pass the threshold — the first reflects broad participation across the ensemble, the second a thin majority among few active voters.
Two mechanisms prevent marker clutter on intraday timeframes:
• One marker per episode — when the verdict enters a bullish or bearish state, only the first qualifying signal of that run is marked. The verdict flickering around the threshold (61% → 59% → 62%) does not produce repeated markers; the internal latch resets only when the verdict genuinely changes state.
• Signal Cooldown — a configurable minimum number of bars between same-side markers, which absorbs the remaining case where a brief state change resets the latch and the condition re-triggers shortly after. On a 5-minute chart, a cooldown of 30 bars means at least 2.5 hours between same-direction markers.
Both mechanisms apply per direction — a bearish marker shortly after a bullish one is never suppressed, because an ensemble flip is meaningful information rather than clutter.
█ READING THE CHART
Bar coloring tints candles by the current verdict — cyan for bullish, magenta for bearish, slate for neutral.
Dashboard (top-right by default) shows the current verdict, the bull/bear percentage split with a progress bar, how many trees are actively voting, RSI's state and its agreement with the verdict, and a breakdown of five representative trees showing each one's live weight and how many samples that weight is based on.
█ SETTINGS
Feature Settings — lengths for RSI, MACD, ATR baseline, volume MA, DMI, and the trend MA used by the price-vs-MA feature.
Ensemble Settings
• Outcome Window (bars) — how far ahead each vote is checked against actual price movement
• Min Samples Before Weighting — how many graded votes a tree needs before its real accuracy replaces the neutral 0.5 default
• Bullish / Bearish Threshold % — where the weighted percentage split has to cross before the verdict label changes
Visualization
• Color Bars by Verdict — toggle candle tinting
• Show Confluence Markers — toggle the triangle markers
• Signal Cooldown (bars) — minimum bars between same-side markers; raise this on lower timeframes if markers feel too frequent
Dashboard — toggle the table, choose its position, toggle the per-tree accuracy breakdown.
█ EXAMPLE
Suppose the dashboard shows: Verdict BULLISH, 73% / 27%, 9/15 trees active, RSI at 28 (OVERSOLD), Agreement: AGREE. This means the weighted vote across all 15 trees currently favors upside by roughly 3-to-1, nine of the trees have a non-neutral opinion right now, and the classic RSI reading independently supports the same bullish read. If the per-tree breakdown shows "Calm-Market RSI" at 78% (n=45) while "RSI Extremes" sits at 52% (n=45), that's telling you the version of the RSI rule that only fires during low volatility has actually been considerably more reliable on this chart than the raw, unfiltered version — information a plain RSI plot could never surface on its own.
█ NOTES
Weights start neutral and only become meaningful once each tree has accumulated enough graded votes (set by "Min Samples Before Weighting"). On a fresh chart or a newly added timeframe, expect the dashboard's percentages to be less informative until that history builds up. The ensemble adapts continuously — a tree's weight can and will drift as market conditions change and its track record evolves.
On intraday timeframes, tune the Signal Cooldown to the chart's pace. The default suits higher timeframes; 5-minute and 15-minute charts generally benefit from a larger value.
█ DISCLAIMER
This is an analytical and visualization tool. It does not generate trade signals and does not constitute financial advice. Historical accuracy of any individual rule or the ensemble as a whole does not guarantee future performance.
Mã nguồn mở
Theo đúng tinh thần TradingView, tác giả của tập lệnh này đã công bố nó dưới dạng mã nguồn mở, để các nhà giao dịch có thể xem xét và xác minh chức năng. Chúc mừng tác giả! Mặc dù bạn có thể sử dụng miễn phí, hãy nhớ rằng việc công bố lại mã phải tuân theo Nội quy.

Connect the dots to elevate your trading.
Thông báo miễn trừ trách nhiệm
Thông tin và các ấn phẩm này không nhằm mục đích, và không cấu thành, lời khuyên hoặc khuyến nghị về tài chính, đầu tư, giao dịch hay các loại khác do TradingView cung cấp hoặc xác nhận. Đọc thêm tại Điều khoản Sử dụng.
Mã nguồn mở
Theo đúng tinh thần TradingView, tác giả của tập lệnh này đã công bố nó dưới dạng mã nguồn mở, để các nhà giao dịch có thể xem xét và xác minh chức năng. Chúc mừng tác giả! Mặc dù bạn có thể sử dụng miễn phí, hãy nhớ rằng việc công bố lại mã phải tuân theo Nội quy.
Connect the dots to elevate your trading.
Thông báo miễn trừ trách nhiệm
Thông tin và các ấn phẩm này không nhằm mục đích, và không cấu thành, lời khuyên hoặc khuyến nghị về tài chính, đầu tư, giao dịch hay các loại khác do TradingView cung cấp hoặc xác nhận. Đọc thêm tại Điều khoản Sử dụng.