OPEN-SOURCE SCRIPT
Cập nhật Daily Pivot Breakout Strategy Indicator
Tagline:
A pivot-based breakout system that identifies confirmed daily breakouts with momentum and volume filters, with precise entry timing across all timeframes.
How It Works:
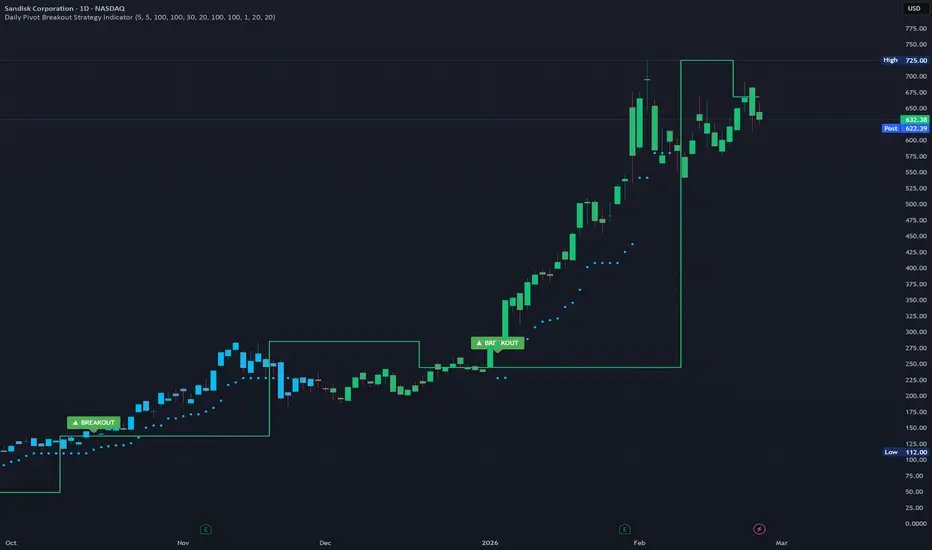
This indicator detects strict pivot high breakouts on daily data, filtered by Rate of Change (ROC ≥30%) and Relative Volume (RVOL >1). It displays both the breakout confirmation signal and the next-day entry signal directly on your chart, regardless of timeframe.
Visual Signals:
Cross-Timeframe Consistency:
Built-in Alert Conditions:
Typical Workflow:
Key Features:
Customizable Inputs:
Note: This indicator is for educational purposes only and does not constitute financial advice. Past performance does not guarantee future results. Always test thoroughly before live trading.
A pivot-based breakout system that identifies confirmed daily breakouts with momentum and volume filters, with precise entry timing across all timeframes.
How It Works:
This indicator detects strict pivot high breakouts on daily data, filtered by Rate of Change (ROC ≥30%) and Relative Volume (RVOL >1). It displays both the breakout confirmation signal and the next-day entry signal directly on your chart, regardless of timeframe.
Visual Signals:
- Orange Pivot Line: The most recent confirmed pivot high (within 250-day lookback)
- Day-0 Label (Teal): Appears on the breakout confirmation day (when price closes above daily pivot with filters met)
- Entry Banner (Green): Appears on the next trading day at market open - your actual entry point
Cross-Timeframe Consistency:
- Daily Chart: View the big picture - Day-0 on breakout bar, Entry on next bar
- Any Timeframe: Logic remains consistent to daily pivots and data, signals adapt to show at the correct time
Built-in Alert Conditions:
- 5PivotBreakout_Scan (Day-0): Fires when breakout is confirmed. Use this for after-hours scanning to build watchlists of confirmed breakouts
- 5PivotBreakout_Strategy (Next): Fires at market open the next day. Use this to automate entries on confirmed breakouts
Typical Workflow:
- Set up Day-0 alerts on your watchlist to catch breakouts as they happen
- Review confirmed breakouts each evening
- Set up Entry alerts on selected tickers to automate next-day execution (fires at market open)
- Optional: Convert to strategy() for backtesting with custom exits (20% trail is good)
Key Features:
- Strict pivot detection: No ties allowed - center must be highest point
- Momentum filter: 100-day ROC ensures trending strength
- Volume confirmation: 20-day RVOL validates participation
- No repainting: Uses lookahead_off for realistic, tradeable signals
Customizable Inputs:
- Pivot strength parameters (left/right bars)
- Pivot lookback period
- ROC period and minimum threshold
- RVOL period
- Toggle visibility of pivot line and labels
Note: This indicator is for educational purposes only and does not constitute financial advice. Past performance does not guarantee future results. Always test thoroughly before live trading.
Phát hành các Ghi chú
Release Notes:- Updated the name of the script
Phát hành các Ghi chú
11/13/25 Updates:- Added modifiable trailing stop % levels based on entries
- Set alerts on these to be notified when a trailing stop loss is hit, or automate orders via webhook
Phát hành các Ghi chú
11/14/25 Updates:- Fixed trail stop dots bug
Phát hành các Ghi chú
11/14/25 Update 2:- Added 15 trailing stop levels
Phát hành các Ghi chú
12/5/25 Updates:- Made the trail stop dots avoid repainting
- Entry bar trail stop uses the previous days close to avoid repainting
Phát hành các Ghi chú
1/30/2026 Update:- Updated code so there is only a single trailing stop line for simplicity
Phát hành các Ghi chú
Update 2/20/26- Changed label to say breakout instead of entry
Phát hành các Ghi chú
2/25/2026 Updates:Added a new EMA Slope % momentum filter.
The indicator now flashes a breakout when either a 100-period ROC>30
OR
When the 100-period EMA slope % > 20
These are both customizable as well.
Phát hành các Ghi chú
2/25/26 Update 2Candles are now colored based on the combined state of two daily momentum filters: Price ROC and EMA Slope %. Each day's color is calculated from confirmed daily bar data and applied to all intraday bars, so the coloring is consistent across all timeframes with no repainting.
Color Key:
🟢 Green (#16C172) — Both bullish: Price ROC is above the minimum threshold AND EMA Slope % is above the minimum threshold. Strongest momentum confirmation.
🔴 Red (#FF3B30) — Both bearish: Price ROC is below the negative threshold AND EMA Slope % is below the negative threshold. Strongest downside momentum.
🟣 Purple (#AF52DE) — Mixed signal: One filter is bullish while the other is bearish. Conflicting momentum, proceed with caution.
🔵 Cyan (#00BCFF) — One bullish: Either Price ROC or EMA Slope % is bullish, but not both. Mild upside momentum.
🟠 Orange (#FF9F0A) — One bearish: Either Price ROC or EMA Slope % is bearish, but not both. Mild downside pressure.
⚫ Gray (#8E8E93) — Neutral: Neither filter is registering a bullish or bearish reading. No directional momentum.
Candle coloring can be toggled on or off via the "Enable Momentum Candle Colors" checkbox in the indicator settings. All thresholds are fully adjustable through the existing ROC, EMA Length, Slope Lookback, Smooth Length, and Minimum EMA Slope inputs.
Mã nguồn mở
Theo đúng tinh thần TradingView, tác giả của tập lệnh này đã công bố nó dưới dạng mã nguồn mở, để các nhà giao dịch có thể xem xét và xác minh chức năng. Chúc mừng tác giả! Mặc dù bạn có thể sử dụng miễn phí, hãy nhớ rằng việc công bố lại mã phải tuân theo Nội quy.

Free trading journal and indicators at financialtechwiz.com/?utm_source=tradingview&utm_medium=profile
Thông báo miễn trừ trách nhiệm
Thông tin và các ấn phẩm này không nhằm mục đích, và không cấu thành, lời khuyên hoặc khuyến nghị về tài chính, đầu tư, giao dịch hay các loại khác do TradingView cung cấp hoặc xác nhận. Đọc thêm tại Điều khoản Sử dụng.
Mã nguồn mở
Theo đúng tinh thần TradingView, tác giả của tập lệnh này đã công bố nó dưới dạng mã nguồn mở, để các nhà giao dịch có thể xem xét và xác minh chức năng. Chúc mừng tác giả! Mặc dù bạn có thể sử dụng miễn phí, hãy nhớ rằng việc công bố lại mã phải tuân theo Nội quy.
Free trading journal and indicators at financialtechwiz.com/?utm_source=tradingview&utm_medium=profile
Thông báo miễn trừ trách nhiệm
Thông tin và các ấn phẩm này không nhằm mục đích, và không cấu thành, lời khuyên hoặc khuyến nghị về tài chính, đầu tư, giao dịch hay các loại khác do TradingView cung cấp hoặc xác nhận. Đọc thêm tại Điều khoản Sử dụng.