OPEN-SOURCE SCRIPT
RTH Previous Day Levels | VAH VAL POC PDH PDL
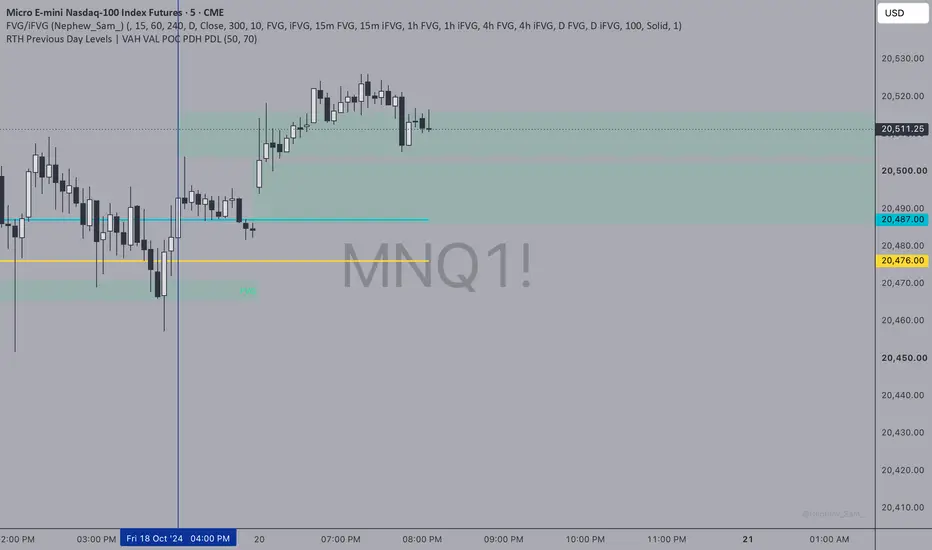
# Previous Day RTH Levels | VAH, VAL, POC, PDH & PDL
This indicator automatically plots five key price levels from the previous trading day's Regular Trading Hours (RTH) session, helping traders identify important areas of support, resistance, liquidity, and potential price acceptance or rejection.
Designed primarily for Nasdaq futures (NQ/MNQ), the indicator uses the New York RTH session (9:30 AM–4:00 PM ET).
### Key Features
- **PDH (Previous Day High):** The highest price reached during the previous RTH session.
- **PDL (Previous Day Low):** The lowest price reached during the previous RTH session.
- **VAH (Value Area High):** The upper boundary of the calculated value area.
- **VAL (Value Area Low):** The lower boundary of the calculated value area.
- **POC (Point of Control):** The price level with the highest estimated trading volume.
### Customization
- Individually enable or disable all five levels.
- Adjust volume profile resolution.
- Customize the value area percentage (70% default).
- Automatically updates levels for each new trading session.
### Trading Applications
Useful for identifying liquidity sweeps, breakouts, reversals, support and resistance, and price acceptance or rejection around previous-session levels.
### Important Notes
Volume profile levels are calculated using an estimated distribution of candle volume across price ranges. Results may differ from TradingView's built-in Volume Profile tools.
Designed for intraday charts, particularly the 5-minute timeframe.
**Disclaimer:** This indicator is intended for educational and technical analysis purposes only. It does not generate buy or sell signals and should not be considered financial advice.
This indicator automatically plots five key price levels from the previous trading day's Regular Trading Hours (RTH) session, helping traders identify important areas of support, resistance, liquidity, and potential price acceptance or rejection.
Designed primarily for Nasdaq futures (NQ/MNQ), the indicator uses the New York RTH session (9:30 AM–4:00 PM ET).
### Key Features
- **PDH (Previous Day High):** The highest price reached during the previous RTH session.
- **PDL (Previous Day Low):** The lowest price reached during the previous RTH session.
- **VAH (Value Area High):** The upper boundary of the calculated value area.
- **VAL (Value Area Low):** The lower boundary of the calculated value area.
- **POC (Point of Control):** The price level with the highest estimated trading volume.
### Customization
- Individually enable or disable all five levels.
- Adjust volume profile resolution.
- Customize the value area percentage (70% default).
- Automatically updates levels for each new trading session.
### Trading Applications
Useful for identifying liquidity sweeps, breakouts, reversals, support and resistance, and price acceptance or rejection around previous-session levels.
### Important Notes
Volume profile levels are calculated using an estimated distribution of candle volume across price ranges. Results may differ from TradingView's built-in Volume Profile tools.
Designed for intraday charts, particularly the 5-minute timeframe.
**Disclaimer:** This indicator is intended for educational and technical analysis purposes only. It does not generate buy or sell signals and should not be considered financial advice.
Mã nguồn mở
Theo đúng tinh thần TradingView, tác giả của tập lệnh này đã công bố nó dưới dạng mã nguồn mở, để các nhà giao dịch có thể xem xét và xác minh chức năng. Chúc mừng tác giả! Mặc dù bạn có thể sử dụng miễn phí, hãy nhớ rằng việc công bố lại mã phải tuân theo Nội quy.

Thông báo miễn trừ trách nhiệm
Thông tin và các ấn phẩm này không nhằm mục đích, và không cấu thành, lời khuyên hoặc khuyến nghị về tài chính, đầu tư, giao dịch hay các loại khác do TradingView cung cấp hoặc xác nhận. Đọc thêm tại Điều khoản Sử dụng.
Mã nguồn mở
Theo đúng tinh thần TradingView, tác giả của tập lệnh này đã công bố nó dưới dạng mã nguồn mở, để các nhà giao dịch có thể xem xét và xác minh chức năng. Chúc mừng tác giả! Mặc dù bạn có thể sử dụng miễn phí, hãy nhớ rằng việc công bố lại mã phải tuân theo Nội quy.
Thông báo miễn trừ trách nhiệm
Thông tin và các ấn phẩm này không nhằm mục đích, và không cấu thành, lời khuyên hoặc khuyến nghị về tài chính, đầu tư, giao dịch hay các loại khác do TradingView cung cấp hoặc xác nhận. Đọc thêm tại Điều khoản Sử dụng.