OPEN-SOURCE SCRIPT
Cập nhật OS RSI Envelope
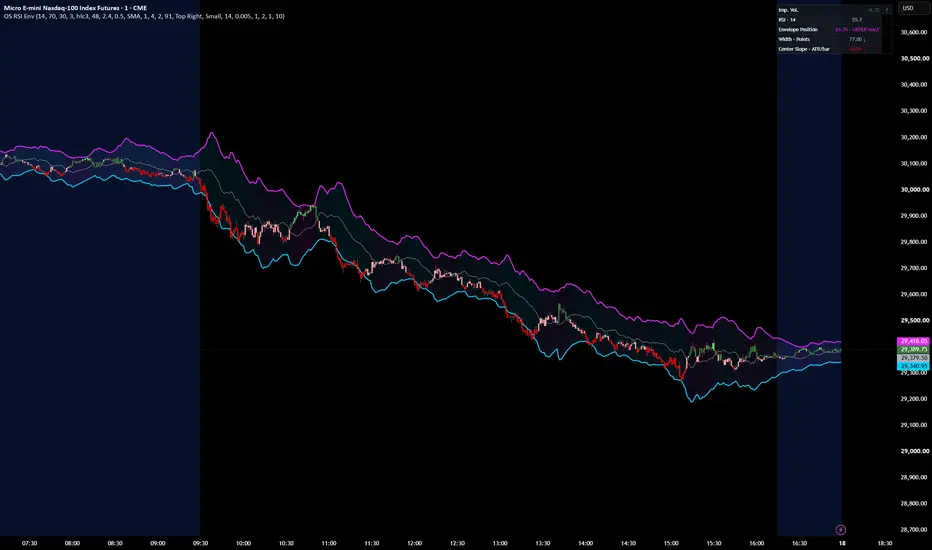
RSI Envelope
The OS RSI Envelope projects dynamic price boundaries where the selected RSI would reach its upper or lower threshold.
With the default 14-period RSI and 70/30 thresholds, the upper boundary represents the price level associated with RSI reaching 70, and the lower boundary represents the level associated with RSI reaching 30.
The boundaries adapt as recent upward and downward price movement changes.
Light smoothing can make them easier to read.
This is a price overlay, not a traditional volatility band.
Its boundaries provide context for where price sits relative to RSI pressure levels; they do not predict reversals or guarantee that price will turn.
How to interpret it
- Between the boundaries: Price is inside the envelope. Its dashboard position shows where it sits: 0% at the lower boundary, 50% at the center, and 100% at the upper boundary.
- Below 0% or above 100%: Price is outside the envelope. This marks movement beyond the projected RSI threshold level; it is not, by itself, a reversal signal.
- Envelope width: The distance between the upper and lower boundaries in price points. Widening means that distance is increasing; narrowing means it is decreasing.
- Center slope: The envelope midpoint’s one-bar change divided by ATR. The arrow and color show whether the midpoint is rising, falling, or relatively flat.
In a strong trend, price can stay near or beyond a boundary. Read the envelope alongside price action and other context; don’t treat a boundary touch alone as a buy or sell signal.
Phát hành các Ghi chú
Updated Impulse Volume CandlesImpulse Volume calculations and candle-color logic adapted from [Impulse Volume Oscillator by AlphaExtract](tradingview.com/script/toO8ErhY-Impulse-Volume-Oscillator-Alpha-Extract/). Licensed under the Mozilla Public License 2.0. Integrated and modified for OS Market Compass.
Mã nguồn mở
Theo đúng tinh thần TradingView, tác giả của tập lệnh này đã công bố nó dưới dạng mã nguồn mở, để các nhà giao dịch có thể xem xét và xác minh chức năng. Chúc mừng tác giả! Mặc dù bạn có thể sử dụng miễn phí, hãy nhớ rằng việc công bố lại mã phải tuân theo Nội quy.

Thông báo miễn trừ trách nhiệm
Thông tin và các ấn phẩm này không nhằm mục đích, và không cấu thành, lời khuyên hoặc khuyến nghị về tài chính, đầu tư, giao dịch hay các loại khác do TradingView cung cấp hoặc xác nhận. Đọc thêm tại Điều khoản Sử dụng.
Mã nguồn mở
Theo đúng tinh thần TradingView, tác giả của tập lệnh này đã công bố nó dưới dạng mã nguồn mở, để các nhà giao dịch có thể xem xét và xác minh chức năng. Chúc mừng tác giả! Mặc dù bạn có thể sử dụng miễn phí, hãy nhớ rằng việc công bố lại mã phải tuân theo Nội quy.
Thông báo miễn trừ trách nhiệm
Thông tin và các ấn phẩm này không nhằm mục đích, và không cấu thành, lời khuyên hoặc khuyến nghị về tài chính, đầu tư, giao dịch hay các loại khác do TradingView cung cấp hoặc xác nhận. Đọc thêm tại Điều khoản Sử dụng.