[SkuldX] BTC OI Delta + Signal
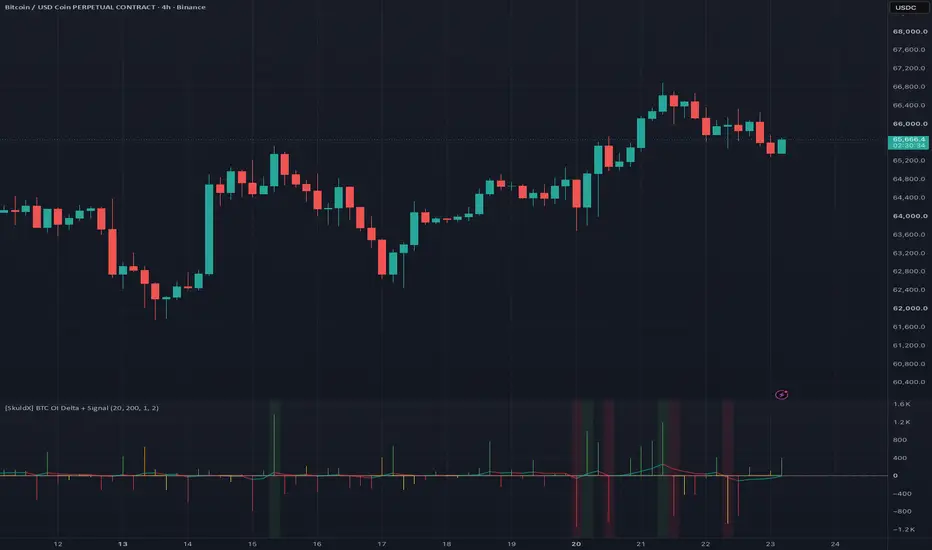
SkuldX BTC OI Delta + Signal — Institutional Positioning Intelligence
by SkuldX Trading Systems
What is it?
SkuldX BTC OI Delta + Signal goes beyond simply showing Open Interest numbers. It decodes the relationship between price movement and OI changes to identify the true nature of every market move — whether it's driven by real conviction or forced liquidations. This distinction is what separates high-probability entries from noise.
How it works
Open Interest Delta measures how many BTC contracts were opened or closed each bar. When combined with price direction, it reveals four distinct market states that form the core of this indicator's signal logic.
The Signal Matrix
🟢 Bullish Trend — price rising + OI increasing. New long positions are being opened. This is genuine buying conviction — the strongest long signal.
🟡 Short Squeeze — price rising + OI decreasing. Shorts are being forcibly closed. Price moves up but no new longs are entering — the move is weak and may not sustain.
🟠 Long Squeeze — price falling + OI increasing. Longs are being liquidated while new shorts open. Counterintuitively, this can precede a reversal once the squeeze exhausts itself.
🔴 Bearish Trend — price falling + OI decreasing. Positions are being closed into a falling market. Strong directional conviction to the downside.
Every histogram bar is color-coded by market state — giving you instant visual context without any manual analysis.
Two-panel layout
Panel 1 — OI Delta Histogram Shows the change in aggregated Open Interest per bar in BTC contracts. An EMA overlay tracks the trend of leverage in the market — rising MA means the market is consistently adding positions, falling MA means deleveraging.
Panel 2 — Z-Score Measures how statistically significant the current OI Delta is relative to recent history. A Z-Score above +2σ means an unusually large OI increase. Below -2σ means an unusually large OI decrease. These extremes often coincide with institutional activity, liquidation cascades, or the start of a significant directional move.
Z-Score levels at ±1σ and ±2σ are displayed with background highlighting for extreme zones.
Data sources
Aggregates perpetual futures Open Interest from five major exchanges — Binance USDT.P, Binance USD.P, Binance BUSD.P, Bybit USDT.P, and OKX USDT.P. Each source can be toggled independently. All values are normalized to BTC contracts for consistent cross-exchange comparison.
Settings
Data Sources — enable or disable each exchange independently
MA Length — EMA period for the delta trend line
Z-Score Lookback — historical window for statistical normalization
Z-Score Levels — configurable ±1σ and ±2σ thresholds
Colors — independent color control for each of the four market states
Signal flags in Data Window
When hovering over any bar, the Data Window shows four binary signal flags — Bullish Trend, Short Squeeze, Long Squeeze, Bearish Trend — alongside raw OI Delta, Total OI, MA, and Z-Score values. These flags are designed to be consumed programmatically in strategy scripts built on top of this indicator.
Notes
Best used on 15m to 4h timeframes where individual OI spikes are meaningful. On very low timeframes (under 5m) noise dominates. The Z-Score panel is most useful for identifying accumulation/distribution phases — sustained readings above +1σ while price consolidates often precede breakouts.
Built for SkuldX ecosystem
This indicator is a core component of the SkuldX signal layer. OI-based market state detection feeds directly into SkuldX automated trading logic for position entry confirmation, squeeze detection, and leverage-driven reversal setups.
by SkuldX Trading Systems
What is it?
SkuldX BTC OI Delta + Signal goes beyond simply showing Open Interest numbers. It decodes the relationship between price movement and OI changes to identify the true nature of every market move — whether it's driven by real conviction or forced liquidations. This distinction is what separates high-probability entries from noise.
How it works
Open Interest Delta measures how many BTC contracts were opened or closed each bar. When combined with price direction, it reveals four distinct market states that form the core of this indicator's signal logic.
The Signal Matrix
🟢 Bullish Trend — price rising + OI increasing. New long positions are being opened. This is genuine buying conviction — the strongest long signal.
🟡 Short Squeeze — price rising + OI decreasing. Shorts are being forcibly closed. Price moves up but no new longs are entering — the move is weak and may not sustain.
🟠 Long Squeeze — price falling + OI increasing. Longs are being liquidated while new shorts open. Counterintuitively, this can precede a reversal once the squeeze exhausts itself.
🔴 Bearish Trend — price falling + OI decreasing. Positions are being closed into a falling market. Strong directional conviction to the downside.
Every histogram bar is color-coded by market state — giving you instant visual context without any manual analysis.
Two-panel layout
Panel 1 — OI Delta Histogram Shows the change in aggregated Open Interest per bar in BTC contracts. An EMA overlay tracks the trend of leverage in the market — rising MA means the market is consistently adding positions, falling MA means deleveraging.
Panel 2 — Z-Score Measures how statistically significant the current OI Delta is relative to recent history. A Z-Score above +2σ means an unusually large OI increase. Below -2σ means an unusually large OI decrease. These extremes often coincide with institutional activity, liquidation cascades, or the start of a significant directional move.
Z-Score levels at ±1σ and ±2σ are displayed with background highlighting for extreme zones.
Data sources
Aggregates perpetual futures Open Interest from five major exchanges — Binance USDT.P, Binance USD.P, Binance BUSD.P, Bybit USDT.P, and OKX USDT.P. Each source can be toggled independently. All values are normalized to BTC contracts for consistent cross-exchange comparison.
Settings
Data Sources — enable or disable each exchange independently
MA Length — EMA period for the delta trend line
Z-Score Lookback — historical window for statistical normalization
Z-Score Levels — configurable ±1σ and ±2σ thresholds
Colors — independent color control for each of the four market states
Signal flags in Data Window
When hovering over any bar, the Data Window shows four binary signal flags — Bullish Trend, Short Squeeze, Long Squeeze, Bearish Trend — alongside raw OI Delta, Total OI, MA, and Z-Score values. These flags are designed to be consumed programmatically in strategy scripts built on top of this indicator.
Notes
Best used on 15m to 4h timeframes where individual OI spikes are meaningful. On very low timeframes (under 5m) noise dominates. The Z-Score panel is most useful for identifying accumulation/distribution phases — sustained readings above +1σ while price consolidates often precede breakouts.
Built for SkuldX ecosystem
This indicator is a core component of the SkuldX signal layer. OI-based market state detection feeds directly into SkuldX automated trading logic for position entry confirmation, squeeze detection, and leverage-driven reversal setups.

Visit skuldxtrade.com to learn more about SkuldX Trading Systems.
Thông báo miễn trừ trách nhiệm
Thông tin và các ấn phẩm này không nhằm mục đích, và không cấu thành, lời khuyên hoặc khuyến nghị về tài chính, đầu tư, giao dịch hay các loại khác do TradingView cung cấp hoặc xác nhận. Đọc thêm tại Điều khoản Sử dụng.
Visit skuldxtrade.com to learn more about SkuldX Trading Systems.
Thông báo miễn trừ trách nhiệm
Thông tin và các ấn phẩm này không nhằm mục đích, và không cấu thành, lời khuyên hoặc khuyến nghị về tài chính, đầu tư, giao dịch hay các loại khác do TradingView cung cấp hoặc xác nhận. Đọc thêm tại Điều khoản Sử dụng.