OPEN-SOURCE SCRIPT
Cập nhật Stop Cascade Detector
Stop Cascade Detector (DAFE)
Unlock the Hidden Triggers of Market Momentum!
The Stop Cascade Detector (Bull & Bear, Info Bubble) is a next-generation tool designed for traders who want to see what the crowd can’t: the precise moments when clusters of stop orders are being triggered, unleashing explosive moves in either direction. The reason for this is traders taking there position too early. We on the other hand will take our positions once the less informed traders have been liquidated.
What Makes This Indicator Unique?
Not Just Another Volatility Tool:
This script doesn’t just measure volatility or volume. It detects the chain reactions that occur when price and volume spikes combine to trigger stop-loss clusters—events that often precede the most powerful surges and reversals in any market.
Directional Intelligence:
Unlike generic “spike” detectors, this tool distinguishes between bullish stop cascades (green, above the bar) and bearish stop cascades (red, below the bar), giving you instant clarity on which side of the market is being liquidated.
Visual Precision:
Each event is marked with a color-coded info bubble and a triangle, clearly separated from the price bars for maximum readability. No more guessing where the action is—see it, trade it, and stay ahead.
Universal Application:
Works on any asset, any timeframe, and in any market—futures, stocks, crypto, forex. If there are stops, this indicator will find the cascade.
What makes it work?
Momentum + Volume Spike:
The detector identifies bars where both price momentum and volume are simultaneously extreme (using Z-scores). This combination is a classic signature of stop runs and forced liquidations.
Bull & Bear Detection:
Bull Stop Cascade: Price plunges downward with a volume spike—likely longs getting stopped out.
Bear Stop Cascade: Price surges upward with a volume spike—likely shorts getting stopped out.
Info Bubbles:
Each event is labeled with the exact Z-scores for momentum and volume, so you can gauge the intensity of the cascade at a glance.
What will it do for you?
Front-Run the Crowd:
Most traders react after the move. This tool helps you spot the cause of the move—giving you a tactical edge to fade exhaustion, ride momentum, or avoid getting trapped.
Perfect for Scalpers, Day Traders, and Swing Traders:
Whether you’re looking for high-probability reversals or want to ride the wave, knowing when stops are being triggered is a game-changer.
No More Blind Spots:
Stop cascades are the hidden fuel behind many of the market’s biggest moves. Now you can see them in real time.
How to Use
Red Bubble Above Bar: Bear stop cascade detected—watch for possible trend acceleration or reversal.
Green Bubble Below Bar: Bull stop cascade detected—watch for possible trend acceleration or reversal.
Combine with Your Strategy: Use as a confirmation tool, a reversal signal, or a filter for high-volatility environments. Level up your trading. See the market’s hidden triggers.
Stop Cascade Detector: Because the real edge is knowing what sets the market on fire.
For educational purposes only. Not financial advice. Always use proper risk management.
Use with discipline. Trade your edge.
— Dskyz, for DAFE Trading Systems
Unlock the Hidden Triggers of Market Momentum!
The Stop Cascade Detector (Bull & Bear, Info Bubble) is a next-generation tool designed for traders who want to see what the crowd can’t: the precise moments when clusters of stop orders are being triggered, unleashing explosive moves in either direction. The reason for this is traders taking there position too early. We on the other hand will take our positions once the less informed traders have been liquidated.
What Makes This Indicator Unique?
Not Just Another Volatility Tool:
This script doesn’t just measure volatility or volume. It detects the chain reactions that occur when price and volume spikes combine to trigger stop-loss clusters—events that often precede the most powerful surges and reversals in any market.
Directional Intelligence:
Unlike generic “spike” detectors, this tool distinguishes between bullish stop cascades (green, above the bar) and bearish stop cascades (red, below the bar), giving you instant clarity on which side of the market is being liquidated.
Visual Precision:
Each event is marked with a color-coded info bubble and a triangle, clearly separated from the price bars for maximum readability. No more guessing where the action is—see it, trade it, and stay ahead.
Universal Application:
Works on any asset, any timeframe, and in any market—futures, stocks, crypto, forex. If there are stops, this indicator will find the cascade.
What makes it work?
Momentum + Volume Spike:
The detector identifies bars where both price momentum and volume are simultaneously extreme (using Z-scores). This combination is a classic signature of stop runs and forced liquidations.
Bull & Bear Detection:
Bull Stop Cascade: Price plunges downward with a volume spike—likely longs getting stopped out.
Bear Stop Cascade: Price surges upward with a volume spike—likely shorts getting stopped out.
Info Bubbles:
Each event is labeled with the exact Z-scores for momentum and volume, so you can gauge the intensity of the cascade at a glance.
What will it do for you?
Front-Run the Crowd:
Most traders react after the move. This tool helps you spot the cause of the move—giving you a tactical edge to fade exhaustion, ride momentum, or avoid getting trapped.
Perfect for Scalpers, Day Traders, and Swing Traders:
Whether you’re looking for high-probability reversals or want to ride the wave, knowing when stops are being triggered is a game-changer.
No More Blind Spots:
Stop cascades are the hidden fuel behind many of the market’s biggest moves. Now you can see them in real time.
How to Use
Red Bubble Above Bar: Bear stop cascade detected—watch for possible trend acceleration or reversal.
Green Bubble Below Bar: Bull stop cascade detected—watch for possible trend acceleration or reversal.
Combine with Your Strategy: Use as a confirmation tool, a reversal signal, or a filter for high-volatility environments. Level up your trading. See the market’s hidden triggers.
Stop Cascade Detector: Because the real edge is knowing what sets the market on fire.
For educational purposes only. Not financial advice. Always use proper risk management.
Use with discipline. Trade your edge.
— Dskyz, for DAFE Trading Systems
Phát hành các Ghi chú
What’s New:Clean Chart, No Clutter:
The old info bubbles near the price bar have been removed for a cleaner, distraction-free trading view.
Dashboard Panel with Timestamps:
A new dashboard in the lower right corner logs the last 5 liquidation events, including event type, time, Z-scores, volume multiple, and a strength gauge.
Note: For the event times to match your chart, set your TradingView chart to UTC and 24-hour format. Otherwise, you can manually adjust.
Event Logging:
The dashboard records the last 5 stop cascade events, so you can see at a glance when and how the market was last “shaken out.”
Strength Gauge Bar:
Each event features a horizontal gauge bar. The more filled the bar, the more extreme the combined momentum and volume spike—helping you instantly spot the most significant cascades.
Event Types Explained:
Bull Event:
+ Green vertical line: Indicates a strong downward move, likely caused by long (bull) liquidations.
+ Red arrow: Signals a possible reversal after the cascade.
Bear Event:
+ Red vertical line: Indicates a strong upward move, likely caused by short (bear) liquidations.
+ Green arrow:Signals a possible reversal after the cascade.
Dashboard:
Use the dashboard to monitor recent liquidation events and their intensity.
The “Strength” bar helps you focus on the most explosive moves.
Events:
Bull: Watch for possible trend acceleration or reversal after a green line (bull liquidation).
Bear: Watch for possible trend acceleration or reversal after a red line (bear liquidation).
Chart Settings:
For accurate event times, set your chart to UTC and 24-hour format.
Why This Matters:
See the Hidden Triggers:
Most traders only see the aftermath. This tool lets you see the cause—the stop cascades that drive the biggest moves.
Universal:
Works on any asset, any timeframe, any market.
For All Styles:
Whether you’re a scalper, day trader, or swing trader, knowing when stops are being triggered gives you a real edge.
For educational purposes only. Not financial advice. Always use proper risk management.
— Dskyz, for DAFE Trading Systems
Phát hành các Ghi chú
* I was running into an issue where certain logged past event metrics continued to update. I believe i got it fixed, and should just log the event.Phát hành các Ghi chú
Last update: I encountered an error where the most recent logged event would duplicate on the second line. This was initially hard to spot, especially when running on 1-minute frames due to the frequency of events. After identifying the issue, I fixed the logging logic and tested it on 1-second frames to ensure accuracy. The logging error is now resolved. The chart now confirms that this indicator works as intended on any timeframe.Phát hành các Ghi chú
Stop Cascade Detector (DAFE)
What makes this script original?
The Stop Cascade Detector is unique because it combines both momentum and volume Z-scores to detect stop cascades—chain reactions of forced liquidations—rather than just price or volume spikes alone. The dashboard logs and visual markers provide a real-time, quantifiable view of these rare events, which are often invisible to standard volatility or volume tools.
How does it work?
Momentum + Volume Z-Scores: Detects bars where both price momentum and volume are simultaneously extreme, a classic signature of stop runs and forced liquidations.
Bull/Bear Detection:
Bull Stop Cascade: Price plunges with a volume spike (likely long liquidations).
Bear Stop Cascade: Price surges with a volume spike (likely short liquidations).
Dashboard:
Logs the last 5 stop cascade events, showing event type (bull/bear), time, momentum Z-score (MZ), volume Z-score (VZ), volume multiple (current volume vs. average), and a strength gauge bar (higher = more extreme event).
Visual Markers:
Green/red lines/arrows on the chart mark the location and direction of each event.
How to use:
- Apply to any asset and timeframe.
- Watch for green (bull) or red (bear) markers and dashboard events.
- Use the dashboard to review recent stop cascades and their intensity.
- Use as a confirmation tool, reversal signal, or filter for high-volatility environments.
- For accurate event times, set your chart to UTC and 24-hour format.
Inputs:
Momentum Lookback: Number of bars for momentum calculation.
Volume Spike Lookback: Number of bars for volume Z-score calculation.
Cascade Z-Score Threshold: Minimum Z-score for both momentum and volume to trigger a stop cascade event.
Chart Info:
Script name: “Stop Cascade Detector”
Recommended for use on any asset or timeframe.
Note:
Markers and dashboard events indicate stop cascade events, not direct buy or sell signals. Use as informational alerts or filters within your own strategy.
Disclaimer:
This script is for research and informational purposes only, not financial advice. Trading is risky—backtest, paper trade, and know your risk before going live. Past performance is not a guarantee of future results.
Release Notes:
Dashboard now logs last 5 stop cascade events with event type, time, Z-scores, volume multiple, and strength gauge.
Chart markers and dashboard are fully synchronized for clarity.
Phát hành các Ghi chú
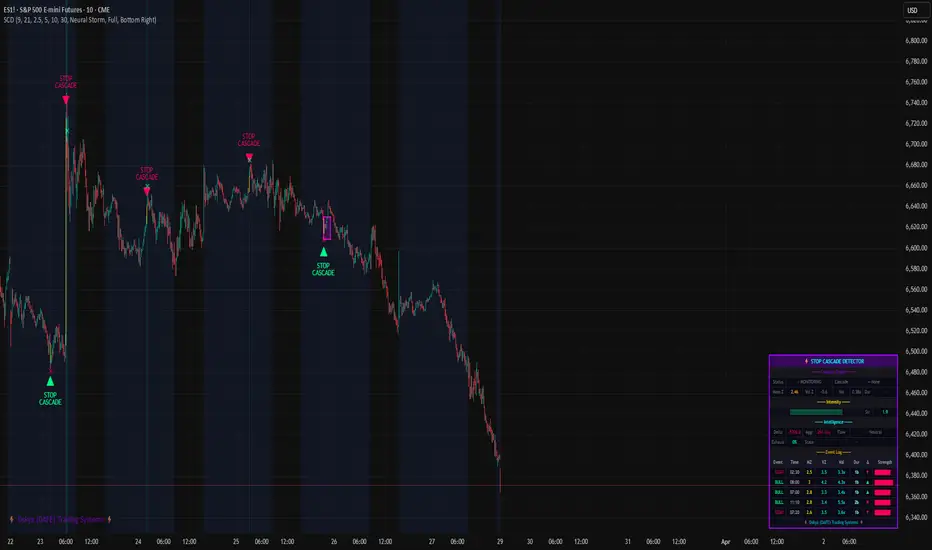
An update has been released for the Stop Cascade Detector transforming it from a focused event detection tool into a comprehensive liquidation intelligence engine. While the core logic of identifying stop cascades through simultaneous momentum and volume z-score anomalies has been preserved, this new version builds a sophisticated analytical framework around that trigger to provide traders with deeper context, real-time analysis, and post-event insights.Expanded Analytical Framework:
The indicator now moves beyond simple detection and incorporates a multi-stage analysis of each cascade event:
Cascade Zones & Aftermath Analysis: Instead of just marking the trigger bar, the indicator now draws "Cascade Zone" boxes that visually track the full duration and price range of an entire stop-run event. Furthermore, once a cascade concludes, it automatically plots "Aftermath Levels" (the high and low of the cascade zone) that serve as potential mean-reversion targets.
Real-time Intensity Gauge: The abstract "strength" of a cascade is now quantified and visualized as a real-time Intensity Gauge. This provides an immediate sense of the event's power and significance as it unfolds.
Exhaustion Detection: A new "Intelligence" module has been added to detect when a cascade's momentum is fading, even while the event is still technically active. This Exhaustion Score helps identify potential reversal points at the tail end of a liquidation event.
Integration of Delta Flow Intelligence:
Directional Confirmation: The system now incorporates a Delta Flow Engine that provides an estimation of the net buying and selling pressure within each bar of the cascade. This adds a crucial layer of confirmation by revealing whether the order flow is aligned with the direction of the stop run or if there is a divergence (e.g., heavy buying into a downward cascade, indicating absorption).
Complete Visual and Dashboard Overhaul:
Thematic Visual Modes: The indicator now features multiple professional visual themes ("Quantum Plasma," "Neural Storm," etc.) with distinct color palettes and aesthetics, allowing for deep user customization.
Dynamic, Multi-Section Dashboard: The original, simple event log has been replaced by a comprehensive, multi-section dashboard. It is fully customizable (Full, Compact, Mini) and provides a detailed real-time overview of the active cascade, including its status, intensity, duration, z-scores, and all the new intelligence metrics (Delta Flow, Exhaustion).
Comprehensive Event Log: The dashboard's "Event Log" has been significantly enhanced. It now tracks not only the direction and strength but also the duration and peak delta for each of the most recent cascade events, creating a rich historical record.
Enhanced Usability and Alerts:
Context-Rich Visuals: The entire visual system has been re-engineered for clarity. New markers differentiate the start, end, and active phases of a cascade, and unique diamond markers appear to warn of exhaustion.
Advanced Alerts: The alert system has been expanded to be more granular and actionable. It can now trigger distinct alerts for a new cascade, the end of a cascade, and, most importantly, for cascade exhaustion, providing traders with timely notifications at critical turning points.
In summary, the Stop Cascade Detector has evolved from an "event-spotter" into a full-cycle analytical tool. It now not only identifies the ignition of a stop cascade but also tracks its life, measures its intensity, analyzes the underlying order flow, and predicts its potential exhaustion, providing traders with a complete intelligence picture from start to finish.
Mã nguồn mở
Theo đúng tinh thần TradingView, tác giả của tập lệnh này đã công bố nó dưới dạng mã nguồn mở, để các nhà giao dịch có thể xem xét và xác minh chức năng. Chúc mừng tác giả! Mặc dù bạn có thể sử dụng miễn phí, hãy nhớ rằng việc công bố lại mã phải tuân theo Nội quy.

Thông báo miễn trừ trách nhiệm
Thông tin và các ấn phẩm này không nhằm mục đích, và không cấu thành, lời khuyên hoặc khuyến nghị về tài chính, đầu tư, giao dịch hay các loại khác do TradingView cung cấp hoặc xác nhận. Đọc thêm tại Điều khoản Sử dụng.
Mã nguồn mở
Theo đúng tinh thần TradingView, tác giả của tập lệnh này đã công bố nó dưới dạng mã nguồn mở, để các nhà giao dịch có thể xem xét và xác minh chức năng. Chúc mừng tác giả! Mặc dù bạn có thể sử dụng miễn phí, hãy nhớ rằng việc công bố lại mã phải tuân theo Nội quy.
Thông báo miễn trừ trách nhiệm
Thông tin và các ấn phẩm này không nhằm mục đích, và không cấu thành, lời khuyên hoặc khuyến nghị về tài chính, đầu tư, giao dịch hay các loại khác do TradingView cung cấp hoặc xác nhận. Đọc thêm tại Điều khoản Sử dụng.