OPEN-SOURCE SCRIPT
MACD Trend Phase MTF by [Itto Ryu]
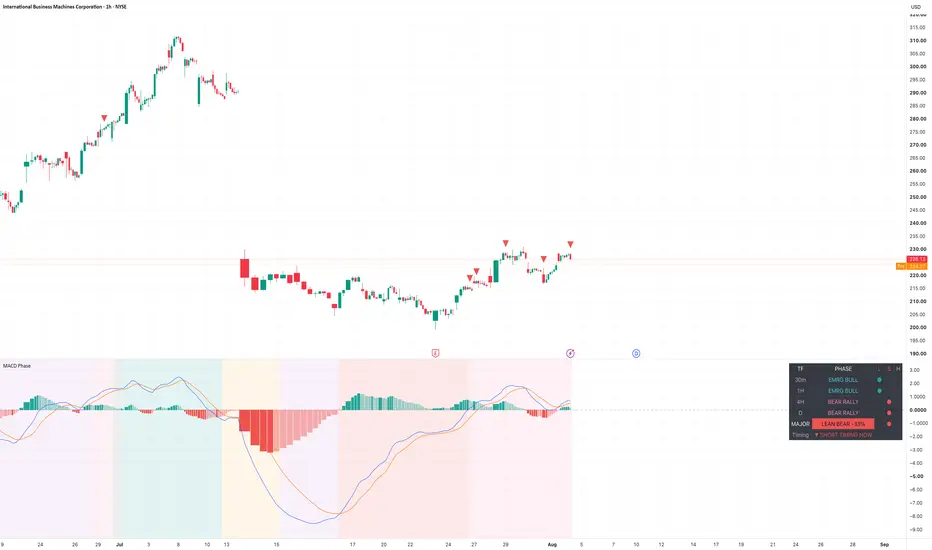
# MACD Trend Phase MTF by [Itto Ryu] — User Manual (Publication Version)
---
## 1 · Purpose
This indicator answers one question: **"Where are we in the trend lifecycle?"** — not merely "has MACD crossed yet?"
A single MACD can only describe momentum state; it cannot describe trend *phase*, because phase emerges from the relationship between multiple timeframes. This script reads a PPO-normalized MACD across three time layers — a slow timeframe sets the regime, a mid timeframe defines the phase, and the chart timeframe tracks entry timing — then outputs an instantly readable phase name, a multi-timeframe dashboard, and a weighted consensus verdict (MAJOR).
Because everything is normalized to percentages, it works on any market and any symbol: index futures, stocks, crypto, or forex.
## 2 · Methodology
**Engine — PPO (Percentage Price Oscillator):**
```
PPO = (EMA(close,12) − EMA(close,26)) / EMA(close,26) × 100
Signal = EMA(PPO, 9)
Hist = PPO − Signal
```
PPO is used instead of raw MACD so thresholds stay constant across markets and across years (raw MACD is denominated in price units and cannot be compared across symbols).
**Phase state machine (computed on the Phase TF, default 4H):** each timeframe uses only three features:
1. **Regime** — PPO above/below zero
2. **Impulse** — PPO above/below its signal line
3. **Leg-peak memory** — is the latest impulse leg's PPO peak lower than the previous leg's peak? (structural momentum divergence)
Combined with the slow-TF regime, this yields 9 phases:
| Phase | Condition | Meaning |
|---|---|---|
| ESTABLISHED BULL | Slow bull + mid bull + impulse up | Fully aligned uptrend |
| BULL PULLBACK | Mid bull + impulse down + peaks not declining | Correction inside an uptrend — a classic continuation setup |
| WEAKENING BULL | Mid bull + impulse down + lower peaks | Late-stage uptrend — momentum thinning |
| EMERGING BULL | Mid bull but slow TF not yet bull | New trend, not yet confirmed |
| TRANSITION / CHOP | \|PPO\| < chop threshold | No phase — directionless market |
| (4 BEAR phases = mirror) | | BEAR RALLY = the mirror continuation setup |
**Anti-flicker:** the committed phase changes only after the new raw phase persists for N chart bars (default 2) — hysteresis prevents flickering.
**Timing signal:** when the phase is a pullback phase and the chart-TF histogram inflects back in the trend direction (`hist > hist[1]` after falling, or the mirror), a ▲/▼ triangle prints on the price chart. The idea: the higher timeframe defines *where* momentum entries make conceptual sense; the chart timeframe shows *when* the counter-move is fading.
**MAJOR consensus:** each grid TF scores its phase (Established ±1.0, Pullback ±0.75, Emerging ±0.5, Weakening ±0.25, Chop 0), weighted by timeframe (default 30m×1, 1H×1.5, 4H×2, D×3) → summed into a net % → |net| ≥ 20% = LONG/SHORT lean, ≥ 50% = strong. This is a structured way of reading multi-timeframe agreement at a glance — higher timeframes get louder votes.
## 3 · Defaults (Inputs)
| Input | Default | Rationale |
|---|---|---|
| Regime TF | D | Slowest layer; only its zero-line side is used |
| Phase TF | 240 (4H) | Phase-defining layer — roughly 4–6× the chart TF works well |
| Fast / Slow / Signal | 12 / 26 / 9 | Standard values, identical on every TF — deliberately untuned |
| Chop threshold | 0.10% | \|PPO\| below this = directionless market |
| Phase confirm bars | 2 | Hysteresis against phase flicker |
| Grid TFs | 30m / 1H / 4H / D | Dashboard rows |
| Weights | 1 / 1.5 / 2 / 3 | Higher timeframes get louder votes |
| Major bias / Strong | 20% / 50% | Verdict thresholds |
| Dashboard size | Middle | Tiny / Middle / Large |
All defaults are starting points, not optimized values — adjust them to your market and timeframe structure.
## 4 · Visual Elements
| Element | Meaning |
|---|---|
| Histogram columns (pane) | Chart-TF PPO − Signal; solid color = accelerating, faded = fading |
| Blue / orange lines (pane) | Chart-TF PPO / Signal |
| Pane background color | Current phase (green = bull family, red = bear family, orange = weakening, gray = chop) |
| ▲ / ▼ on the price chart | Timing markers — phase-gated momentum inflections |
| TF grid table | Phase per timeframe + ● dot in the L / S / H column |
| MAJOR row | Weighted consensus verdict + net % |
| Timing row | Timing status ("wait" / "TIMING NOW") |
| ⚠ row | Warns when chart TF ≥ Phase TF (view a lower TF, e.g. 1H) |
## 5 · Who This Is For / NOT For
**For:** traders studying trend-pullback structure who execute manually and use indicators as context filters; anyone who wants a one-glance answer to "is this market trending, correcting, weakening, or going nowhere?"
**NOT for:** scalpers far below the phase TF (higher-TF data updates too slowly to matter); anyone expecting a fully automatic buy/sell system (this is decision support, not a bot); extended sideways markets (it will mostly show CHOP — which is the correct reading: no trend phase exists).
## 6 · How to Use (Study Playbook)
1. Open the chart one or more steps **below the Phase TF** (e.g. 1H chart with a 4H phase TF).
2. Use the background color and phase label as context: trend-following ideas align with ESTABLISHED phases, continuation setups form during PULLBACK / RALLY phases, and WEAKENING or CHOP suggest standing aside.
3. Check the **MAJOR** row — study how often lower and higher timeframes agree before strong moves, and how disagreement resolves.
4. The ▲/▼ triangles mark where a counter-trend swing's momentum fades *while the higher timeframe still points with the trend* — the classic pullback-entry concept. Observe how these behave on your market before acting on any of them.
5. Momentum-inflection signals are, by nature, short-horizon events — they describe the next swing, not the next month. Re-evaluate whenever the phase changes.
6. Alerts: alert dialog → Condition = "MACD Phase" → choose "Phase changed", "Major bias changed", "Long timing" or "Short timing" → recommended trigger **Once per bar close**.
7. WEAKENING is best studied as a position-management state (momentum thinning), not a reversal signal.
## 7 · Common Mistakes
- ❌ Treating ESTABLISHED phases as entry signals — by the time everything is aligned, much of the move has often happened; the pullback phases are where continuation logic actually applies.
- ❌ Taking every triangle in both directions on every market — different markets have different structural drifts; study each side's behavior on your instrument first.
- ❌ Expecting momentum-inflection signals to define long swings — their information decays quickly.
- ❌ Viewing on a chart TF larger than the Phase TF (the ⚠ row will warn you).
- ❌ Reading MAJOR % as a probability — it is a weighted vote score (a structured prior), not a measured probability.
- ❌ Changing several inputs at once — you lose track of what actually changed the behavior.
## 8 · For Educational Purposes Only
This indicator is published **for educational purposes only**. It is a tool for studying how momentum, trend phase, and multi-timeframe structure interact — it is **not** a trading system, does not generate financial advice, and makes **no claim of profitability**. No performance figures are stated or implied; past behavior of any signal, on any market, does not guarantee future results. Before risking real capital on any concept illustrated here, do your own testing on your own market, timeframe, and cost structure, and consult a licensed financial professional where appropriate. You alone are responsible for your trading decisions.
## 9 · Disclosure Block
- **Pine version:** v6
- **Repaint:** NO on closed bars — every HTF value uses only fully closed bars (`security(expr[1], lookahead_on)` idiom); historical bars are never redrawn. Note: current-bar table values and signals update until the bar closes — use alerts set to "Once per bar close".
- **Chart type:** standard candles only (no Heikin Ashi / Renko / Range — synthetic prices distort PPO).
- **Originality:** fully original code — the phase state machine, leg-peak memory, and weighted MTF consensus were written from scratch, not adapted from any open-source script.
- **This indicator is create for educational purposes only — not investment advice or recommendation or professional advice, you are on your own risk **
---
---
## 1 · Purpose
This indicator answers one question: **"Where are we in the trend lifecycle?"** — not merely "has MACD crossed yet?"
A single MACD can only describe momentum state; it cannot describe trend *phase*, because phase emerges from the relationship between multiple timeframes. This script reads a PPO-normalized MACD across three time layers — a slow timeframe sets the regime, a mid timeframe defines the phase, and the chart timeframe tracks entry timing — then outputs an instantly readable phase name, a multi-timeframe dashboard, and a weighted consensus verdict (MAJOR).
Because everything is normalized to percentages, it works on any market and any symbol: index futures, stocks, crypto, or forex.
## 2 · Methodology
**Engine — PPO (Percentage Price Oscillator):**
```
PPO = (EMA(close,12) − EMA(close,26)) / EMA(close,26) × 100
Signal = EMA(PPO, 9)
Hist = PPO − Signal
```
PPO is used instead of raw MACD so thresholds stay constant across markets and across years (raw MACD is denominated in price units and cannot be compared across symbols).
**Phase state machine (computed on the Phase TF, default 4H):** each timeframe uses only three features:
1. **Regime** — PPO above/below zero
2. **Impulse** — PPO above/below its signal line
3. **Leg-peak memory** — is the latest impulse leg's PPO peak lower than the previous leg's peak? (structural momentum divergence)
Combined with the slow-TF regime, this yields 9 phases:
| Phase | Condition | Meaning |
|---|---|---|
| ESTABLISHED BULL | Slow bull + mid bull + impulse up | Fully aligned uptrend |
| BULL PULLBACK | Mid bull + impulse down + peaks not declining | Correction inside an uptrend — a classic continuation setup |
| WEAKENING BULL | Mid bull + impulse down + lower peaks | Late-stage uptrend — momentum thinning |
| EMERGING BULL | Mid bull but slow TF not yet bull | New trend, not yet confirmed |
| TRANSITION / CHOP | \|PPO\| < chop threshold | No phase — directionless market |
| (4 BEAR phases = mirror) | | BEAR RALLY = the mirror continuation setup |
**Anti-flicker:** the committed phase changes only after the new raw phase persists for N chart bars (default 2) — hysteresis prevents flickering.
**Timing signal:** when the phase is a pullback phase and the chart-TF histogram inflects back in the trend direction (`hist > hist[1]` after falling, or the mirror), a ▲/▼ triangle prints on the price chart. The idea: the higher timeframe defines *where* momentum entries make conceptual sense; the chart timeframe shows *when* the counter-move is fading.
**MAJOR consensus:** each grid TF scores its phase (Established ±1.0, Pullback ±0.75, Emerging ±0.5, Weakening ±0.25, Chop 0), weighted by timeframe (default 30m×1, 1H×1.5, 4H×2, D×3) → summed into a net % → |net| ≥ 20% = LONG/SHORT lean, ≥ 50% = strong. This is a structured way of reading multi-timeframe agreement at a glance — higher timeframes get louder votes.
## 3 · Defaults (Inputs)
| Input | Default | Rationale |
|---|---|---|
| Regime TF | D | Slowest layer; only its zero-line side is used |
| Phase TF | 240 (4H) | Phase-defining layer — roughly 4–6× the chart TF works well |
| Fast / Slow / Signal | 12 / 26 / 9 | Standard values, identical on every TF — deliberately untuned |
| Chop threshold | 0.10% | \|PPO\| below this = directionless market |
| Phase confirm bars | 2 | Hysteresis against phase flicker |
| Grid TFs | 30m / 1H / 4H / D | Dashboard rows |
| Weights | 1 / 1.5 / 2 / 3 | Higher timeframes get louder votes |
| Major bias / Strong | 20% / 50% | Verdict thresholds |
| Dashboard size | Middle | Tiny / Middle / Large |
All defaults are starting points, not optimized values — adjust them to your market and timeframe structure.
## 4 · Visual Elements
| Element | Meaning |
|---|---|
| Histogram columns (pane) | Chart-TF PPO − Signal; solid color = accelerating, faded = fading |
| Blue / orange lines (pane) | Chart-TF PPO / Signal |
| Pane background color | Current phase (green = bull family, red = bear family, orange = weakening, gray = chop) |
| ▲ / ▼ on the price chart | Timing markers — phase-gated momentum inflections |
| TF grid table | Phase per timeframe + ● dot in the L / S / H column |
| MAJOR row | Weighted consensus verdict + net % |
| Timing row | Timing status ("wait" / "TIMING NOW") |
| ⚠ row | Warns when chart TF ≥ Phase TF (view a lower TF, e.g. 1H) |
## 5 · Who This Is For / NOT For
**For:** traders studying trend-pullback structure who execute manually and use indicators as context filters; anyone who wants a one-glance answer to "is this market trending, correcting, weakening, or going nowhere?"
**NOT for:** scalpers far below the phase TF (higher-TF data updates too slowly to matter); anyone expecting a fully automatic buy/sell system (this is decision support, not a bot); extended sideways markets (it will mostly show CHOP — which is the correct reading: no trend phase exists).
## 6 · How to Use (Study Playbook)
1. Open the chart one or more steps **below the Phase TF** (e.g. 1H chart with a 4H phase TF).
2. Use the background color and phase label as context: trend-following ideas align with ESTABLISHED phases, continuation setups form during PULLBACK / RALLY phases, and WEAKENING or CHOP suggest standing aside.
3. Check the **MAJOR** row — study how often lower and higher timeframes agree before strong moves, and how disagreement resolves.
4. The ▲/▼ triangles mark where a counter-trend swing's momentum fades *while the higher timeframe still points with the trend* — the classic pullback-entry concept. Observe how these behave on your market before acting on any of them.
5. Momentum-inflection signals are, by nature, short-horizon events — they describe the next swing, not the next month. Re-evaluate whenever the phase changes.
6. Alerts: alert dialog → Condition = "MACD Phase" → choose "Phase changed", "Major bias changed", "Long timing" or "Short timing" → recommended trigger **Once per bar close**.
7. WEAKENING is best studied as a position-management state (momentum thinning), not a reversal signal.
## 7 · Common Mistakes
- ❌ Treating ESTABLISHED phases as entry signals — by the time everything is aligned, much of the move has often happened; the pullback phases are where continuation logic actually applies.
- ❌ Taking every triangle in both directions on every market — different markets have different structural drifts; study each side's behavior on your instrument first.
- ❌ Expecting momentum-inflection signals to define long swings — their information decays quickly.
- ❌ Viewing on a chart TF larger than the Phase TF (the ⚠ row will warn you).
- ❌ Reading MAJOR % as a probability — it is a weighted vote score (a structured prior), not a measured probability.
- ❌ Changing several inputs at once — you lose track of what actually changed the behavior.
## 8 · For Educational Purposes Only
This indicator is published **for educational purposes only**. It is a tool for studying how momentum, trend phase, and multi-timeframe structure interact — it is **not** a trading system, does not generate financial advice, and makes **no claim of profitability**. No performance figures are stated or implied; past behavior of any signal, on any market, does not guarantee future results. Before risking real capital on any concept illustrated here, do your own testing on your own market, timeframe, and cost structure, and consult a licensed financial professional where appropriate. You alone are responsible for your trading decisions.
## 9 · Disclosure Block
- **Pine version:** v6
- **Repaint:** NO on closed bars — every HTF value uses only fully closed bars (`security(expr[1], lookahead_on)` idiom); historical bars are never redrawn. Note: current-bar table values and signals update until the bar closes — use alerts set to "Once per bar close".
- **Chart type:** standard candles only (no Heikin Ashi / Renko / Range — synthetic prices distort PPO).
- **Originality:** fully original code — the phase state machine, leg-peak memory, and weighted MTF consensus were written from scratch, not adapted from any open-source script.
- **This indicator is create for educational purposes only — not investment advice or recommendation or professional advice, you are on your own risk **
---
Mã nguồn mở
Theo đúng tinh thần TradingView, tác giả của tập lệnh này đã công bố nó dưới dạng mã nguồn mở, để các nhà giao dịch có thể xem xét và xác minh chức năng. Chúc mừng tác giả! Mặc dù bạn có thể sử dụng miễn phí, hãy nhớ rằng việc công bố lại mã phải tuân theo Nội quy.

Thông báo miễn trừ trách nhiệm
Thông tin và các ấn phẩm này không nhằm mục đích, và không cấu thành, lời khuyên hoặc khuyến nghị về tài chính, đầu tư, giao dịch hay các loại khác do TradingView cung cấp hoặc xác nhận. Đọc thêm tại Điều khoản Sử dụng.
Mã nguồn mở
Theo đúng tinh thần TradingView, tác giả của tập lệnh này đã công bố nó dưới dạng mã nguồn mở, để các nhà giao dịch có thể xem xét và xác minh chức năng. Chúc mừng tác giả! Mặc dù bạn có thể sử dụng miễn phí, hãy nhớ rằng việc công bố lại mã phải tuân theo Nội quy.
Thông báo miễn trừ trách nhiệm
Thông tin và các ấn phẩm này không nhằm mục đích, và không cấu thành, lời khuyên hoặc khuyến nghị về tài chính, đầu tư, giao dịch hay các loại khác do TradingView cung cấp hoặc xác nhận. Đọc thêm tại Điều khoản Sử dụng.