Cập nhật
Frostman04 DOL
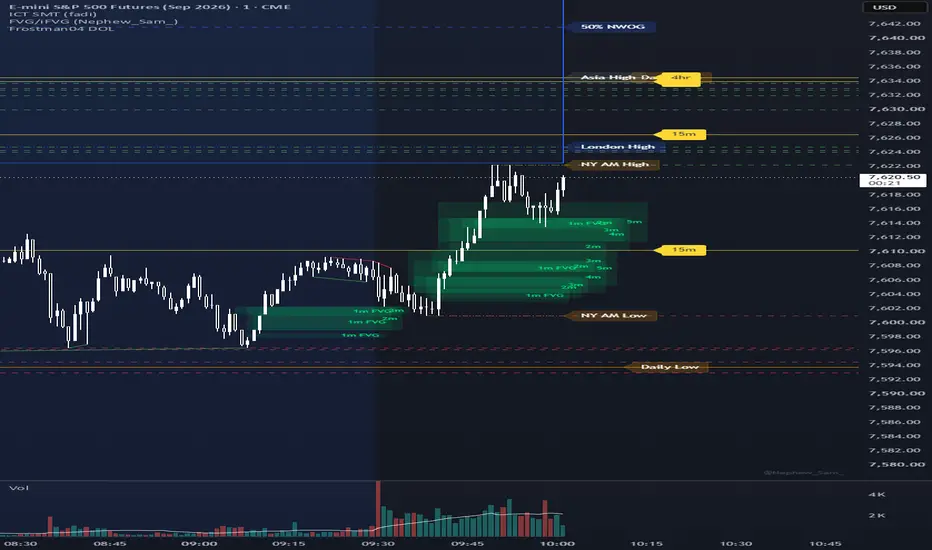
This is my indicator to Mark out Potential Draws on Liquidity.
When you add this indicator, it marks out several lines on the chart. Each one is a potential type of draw on liquidity.
Price likes to move towards unmitigated gaps.
Price like to take out session highs and lows.
Price likes to take out Equal Highs and Equal Lows.
Price likes to take out News Highs and News Lows.
Price likes to take out the current Daily High and Daily Low.
It is meant to be watched on the one-minute time frame.
First, it borrows the Equal Highs and Equal Lows by OutOfOptions.
Marking out any EXACT equal Highs and Lows.
If the line is swept by another candle, it is removed.
Next, it draws a horizontal line marking the Current Daily High and Current Daily Low with a label.
If a candle touches or goes beyond the line, it moves the line with the highest/lowest candle of the day.
Then, it marks out in yellow any unmitigated Fair Value Gaps on the 15m, 1hr, 4hr, and daily charts. But it has a max lookback period, so keep this in mind. If it's really far back, you may have to mark some yourself.
If an unmitigated gap line is touched, the line is removed.
Next, It marks the Session Highs and Lows for the current trading day: Asia High/Low, London High/Low, NY AM High/Low. I didn't include NY PM at this time.
If still in the session time the high and low are moved up or down.
If outside the session time, the candle that takes out the high/low is anochored to the line, otherwise, the session high/low lines are extended for the day until it is swept or a new trading day begins.
Finally, It marks out any News candles based on:
8:15, 8:30, 10am, 2pm and 2:30pm NY time. Also watching for ATR and volume spike on those times.
If a news candle line is swept, it is removed.
This has two variables of note: The first lookback is the number of days.
The second lookback is the number of candles back to check when averaging volume to check for volume spikes.
Thank you,
Frostman04
When you add this indicator, it marks out several lines on the chart. Each one is a potential type of draw on liquidity.
Price likes to move towards unmitigated gaps.
Price like to take out session highs and lows.
Price likes to take out Equal Highs and Equal Lows.
Price likes to take out News Highs and News Lows.
Price likes to take out the current Daily High and Daily Low.
It is meant to be watched on the one-minute time frame.
First, it borrows the Equal Highs and Equal Lows by OutOfOptions.
Marking out any EXACT equal Highs and Lows.
If the line is swept by another candle, it is removed.
Next, it draws a horizontal line marking the Current Daily High and Current Daily Low with a label.
If a candle touches or goes beyond the line, it moves the line with the highest/lowest candle of the day.
Then, it marks out in yellow any unmitigated Fair Value Gaps on the 15m, 1hr, 4hr, and daily charts. But it has a max lookback period, so keep this in mind. If it's really far back, you may have to mark some yourself.
If an unmitigated gap line is touched, the line is removed.
Next, It marks the Session Highs and Lows for the current trading day: Asia High/Low, London High/Low, NY AM High/Low. I didn't include NY PM at this time.
If still in the session time the high and low are moved up or down.
If outside the session time, the candle that takes out the high/low is anochored to the line, otherwise, the session high/low lines are extended for the day until it is swept or a new trading day begins.
Finally, It marks out any News candles based on:
8:15, 8:30, 10am, 2pm and 2:30pm NY time. Also watching for ATR and volume spike on those times.
If a news candle line is swept, it is removed.
This has two variables of note: The first lookback is the number of days.
The second lookback is the number of candles back to check when averaging volume to check for volume spikes.
Thank you,
Frostman04
Phát hành các Ghi chú
I have added the option to toggle on/off the New Week Open Gap (NWOG) with a 50% line drawn as well.
Thông báo miễn trừ trách nhiệm
Thông tin và các ấn phẩm này không nhằm mục đích, và không cấu thành, lời khuyên hoặc khuyến nghị về tài chính, đầu tư, giao dịch hay các loại khác do TradingView cung cấp hoặc xác nhận. Đọc thêm tại Điều khoản Sử dụng.
Thông báo miễn trừ trách nhiệm
Thông tin và các ấn phẩm này không nhằm mục đích, và không cấu thành, lời khuyên hoặc khuyến nghị về tài chính, đầu tư, giao dịch hay các loại khác do TradingView cung cấp hoặc xác nhận. Đọc thêm tại Điều khoản Sử dụng.