SSMT+
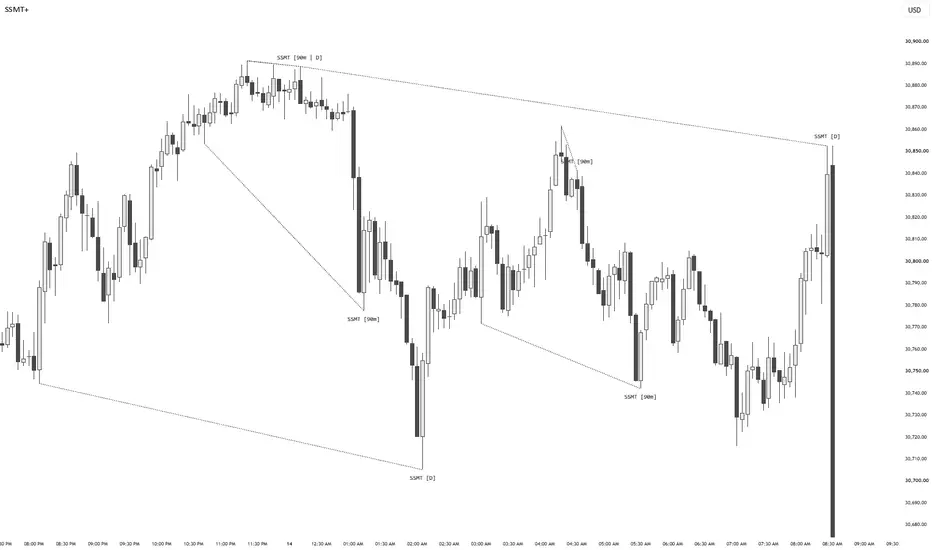
SSMT+ (Sequential SMT)
SSMT+ marks sequential SMT divergence between the chart symbol and one correlated symbol, on five cycles: Micro, 90-Minute, Daily, Weekly and Monthly. When one symbol takes the previous period's high (or low) and the other does not, it draws a labeled line from the previous period's extreme to the current one.
This is an overlay indicator. It does not place orders, manage risk, or produce a strategy report. A mark shows a divergence between two symbols. It is not a buy or sell recommendation and does not imply future results. The script is a descriptive summary of a defined price condition, for study and review.
HOW IT WORKS
All cycles use New York time, with the trading day rolling at 18:00.
- Micro: 22.5-minute blocks
- 90-Minute: four 90-minute blocks in each 6-hour quarter
- Daily: the four 6-hour quarters (Q1 18:00, Q2 00:00, Q3 06:00, Q4 12:00)
- Weekly: the trading week, Monday to Friday
- Monthly: the calendar month
For each cycle, the script keeps the current and the previous period's high and low for both symbols, read on the chart's own timeframe.
1. Bearish SSMT: in the current period one symbol trades above its previous period's high and the other does not.
2. Bullish SSMT: the same at the previous period's low.
3. The mark is a dotted line from the previous period's extreme to this period's extreme on the chart. It follows the extreme while the divergence holds.
4. If both symbols end up trading through the level in the same period, the mark is removed and that side cannot fire again in that period.
5. Once a period ends, its marks stay on the chart as history. Max visible keeps only the most recent ones.
Marks that land on the same spot share one label, for example SSMT [90m | D | W | M], so names never stack. Hover a label for each cycle's detail, including which symbol took the level.
The 17:00 to 18:00 New York CME pause is skipped.
KEY FEATURES
- SSMT on Micro, 90-Minute, Daily (Q1 to Q4), Weekly and Monthly cycles, each toggleable
- Daily quarter filter: show only SSMTs that form in the quarters you tick
- Auto-paired or manual correlated symbol (NQ pairs with ES by default)
- Marks labeled by cycle, merged when they share a spot
- Hover note naming which symbol took the level
- Optional Daily quarter and 90m boxes for timing context
- Max visible and Lookback Period to keep the chart clean
- Black, dotted, Monospace defaults with a label size option
- Alerts for each cycle, high side and low side
HOW TO USE
Apply to NQ or ES (or the micros). Which cycles show depends on the chart timeframe:
- Micro: 1m to 5m
- 90-Minute: 1m to 15m
- Daily: 1m to 1H
- Weekly and Monthly: up to a daily chart
The read is always the same: which cycle diverged, on which side, and how price behaved at the previous period's high or low.
SETTINGS
- Correlated Symbol: Auto or Manual, with a symbol picker.
- Cycles: Micro, 90-Minute, Daily with a Q1 to Q4 filter, Weekly, Monthly.
- Display: Color, line style, Max visible, Lookback Period, Label size.
- Boxes: Daily quarter boxes, 90m boxes.
ALERTS
For each cycle (Micro, 90m, Daily, Weekly, Monthly), one alert for the high side and one for the low side. Each fires on bar close, when the SSMT first forms.
AUTO PAIRS
NQ with ES, ES with NQ, MNQ with MES, MES with MNQ, YM with ES, MYM with MES, using the same contract as the chart. Use Manual for anything else.
LIMITATIONS
- A mark can be removed later in its period if both symbols end up taking the level. The alert fires when it forms, not when the period ends.
- SMT compares bars at the same time on both symbols. Missing bars on one symbol can shift the comparison.
- Micro blocks are 22.5 minutes, which do not line up with whole 1m or 5m bars, so a block edge can sit one bar off.
- The clock is fixed to New York time and the 18:00 roll.
- SSMT quality depends on the benchmark. Correlation between symbols changes across regimes.
- No statistics are included. Divergences are shown, not graded.
- Do not use it on Heikin Ashi, Renko, Kagi, Point and Figure, Line Break or Range charts.
TIPS
- Start with 90-Minute and Daily only. Add Micro when you are reading one session closely.
- Use the Daily quarter filter to look only at Q2 and Q3.
- Turn on the quarter boxes to see where each period's range sits.
SSMT+ marks sequential SMT divergence between the chart symbol and one correlated symbol, on five cycles: Micro, 90-Minute, Daily, Weekly and Monthly. When one symbol takes the previous period's high (or low) and the other does not, it draws a labeled line from the previous period's extreme to the current one.
This is an overlay indicator. It does not place orders, manage risk, or produce a strategy report. A mark shows a divergence between two symbols. It is not a buy or sell recommendation and does not imply future results. The script is a descriptive summary of a defined price condition, for study and review.
HOW IT WORKS
All cycles use New York time, with the trading day rolling at 18:00.
- Micro: 22.5-minute blocks
- 90-Minute: four 90-minute blocks in each 6-hour quarter
- Daily: the four 6-hour quarters (Q1 18:00, Q2 00:00, Q3 06:00, Q4 12:00)
- Weekly: the trading week, Monday to Friday
- Monthly: the calendar month
For each cycle, the script keeps the current and the previous period's high and low for both symbols, read on the chart's own timeframe.
1. Bearish SSMT: in the current period one symbol trades above its previous period's high and the other does not.
2. Bullish SSMT: the same at the previous period's low.
3. The mark is a dotted line from the previous period's extreme to this period's extreme on the chart. It follows the extreme while the divergence holds.
4. If both symbols end up trading through the level in the same period, the mark is removed and that side cannot fire again in that period.
5. Once a period ends, its marks stay on the chart as history. Max visible keeps only the most recent ones.
Marks that land on the same spot share one label, for example SSMT [90m | D | W | M], so names never stack. Hover a label for each cycle's detail, including which symbol took the level.
The 17:00 to 18:00 New York CME pause is skipped.
KEY FEATURES
- SSMT on Micro, 90-Minute, Daily (Q1 to Q4), Weekly and Monthly cycles, each toggleable
- Daily quarter filter: show only SSMTs that form in the quarters you tick
- Auto-paired or manual correlated symbol (NQ pairs with ES by default)
- Marks labeled by cycle, merged when they share a spot
- Hover note naming which symbol took the level
- Optional Daily quarter and 90m boxes for timing context
- Max visible and Lookback Period to keep the chart clean
- Black, dotted, Monospace defaults with a label size option
- Alerts for each cycle, high side and low side
HOW TO USE
Apply to NQ or ES (or the micros). Which cycles show depends on the chart timeframe:
- Micro: 1m to 5m
- 90-Minute: 1m to 15m
- Daily: 1m to 1H
- Weekly and Monthly: up to a daily chart
The read is always the same: which cycle diverged, on which side, and how price behaved at the previous period's high or low.
SETTINGS
- Correlated Symbol: Auto or Manual, with a symbol picker.
- Cycles: Micro, 90-Minute, Daily with a Q1 to Q4 filter, Weekly, Monthly.
- Display: Color, line style, Max visible, Lookback Period, Label size.
- Boxes: Daily quarter boxes, 90m boxes.
ALERTS
For each cycle (Micro, 90m, Daily, Weekly, Monthly), one alert for the high side and one for the low side. Each fires on bar close, when the SSMT first forms.
AUTO PAIRS
NQ with ES, ES with NQ, MNQ with MES, MES with MNQ, YM with ES, MYM with MES, using the same contract as the chart. Use Manual for anything else.
LIMITATIONS
- A mark can be removed later in its period if both symbols end up taking the level. The alert fires when it forms, not when the period ends.
- SMT compares bars at the same time on both symbols. Missing bars on one symbol can shift the comparison.
- Micro blocks are 22.5 minutes, which do not line up with whole 1m or 5m bars, so a block edge can sit one bar off.
- The clock is fixed to New York time and the 18:00 roll.
- SSMT quality depends on the benchmark. Correlation between symbols changes across regimes.
- No statistics are included. Divergences are shown, not graded.
- Do not use it on Heikin Ashi, Renko, Kagi, Point and Figure, Line Break or Range charts.
TIPS
- Start with 90-Minute and Daily only. Add Micro when you are reading one session closely.
- Use the Daily quarter filter to look only at Q2 and Q3.
- Turn on the quarter boxes to see where each period's range sits.

Thông báo miễn trừ trách nhiệm
Thông tin và các ấn phẩm này không nhằm mục đích, và không cấu thành, lời khuyên hoặc khuyến nghị về tài chính, đầu tư, giao dịch hay các loại khác do TradingView cung cấp hoặc xác nhận. Đọc thêm tại Điều khoản Sử dụng.
Thông báo miễn trừ trách nhiệm
Thông tin và các ấn phẩm này không nhằm mục đích, và không cấu thành, lời khuyên hoặc khuyến nghị về tài chính, đầu tư, giao dịch hay các loại khác do TradingView cung cấp hoặc xác nhận. Đọc thêm tại Điều khoản Sử dụng.