Cập nhật
BTC 4-Year Cycle Labels + Future Points
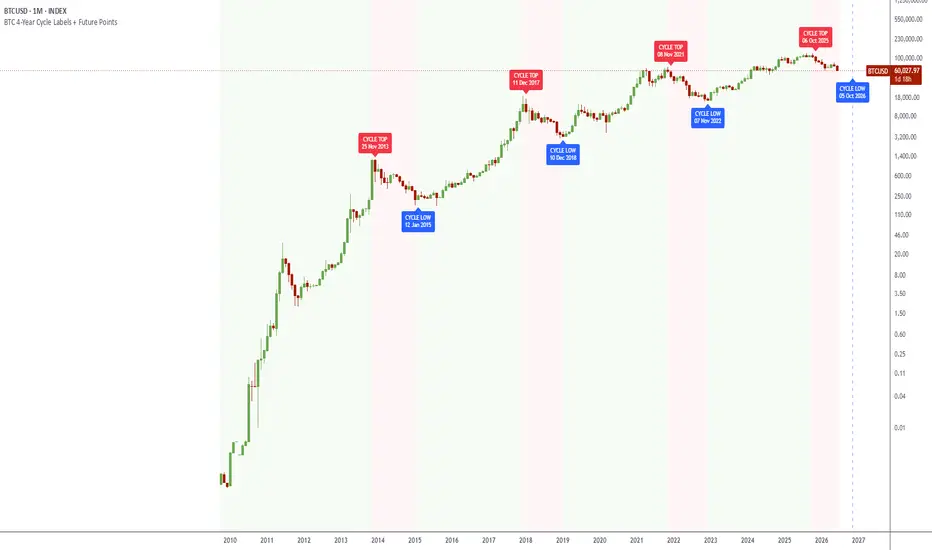
**BTC 4-Year Cycle Labels + Future Points**
This script is a simple visual roadmap for Bitcoin’s historical 4-year rhythm. It marks the major cycle tops and cycle lows that have defined Bitcoin’s previous macro cycles, then projects the next theoretical cycle points forward using the same measured cycle spacing.
The idea behind this tool is not to claim that Bitcoin must repeat the past perfectly. Markets evolve. Liquidity changes. Participants become more sophisticated. The ETF era, institutional flows, macro policy, and global adoption can all distort or even break patterns that once looked obvious.
But that is exactly why this indicator exists.
Bitcoin has spent more than a decade moving through recognizable expansion and contraction phases. Each cycle has had a major euphoric top, followed by a long bear-market drawdown and eventual accumulation low. This script takes those historical turning points and places them directly on the chart so the structure can be seen clearly.
The historical cycle labels included are:
**Cycle Tops**
* 25 Nov 2013
* 11 Dec 2017
* 08 Nov 2021
* Projected: 06 Oct 2025
**Cycle Lows**
* 12 Jan 2015
* 10 Dec 2018
* 07 Nov 2022
* Projected: 05 Oct 2026
The projected dates are based on the recurring spacing from prior Bitcoin cycle pivots. In this version, the projection uses a default 1428-day cycle spacing, which carries the 2021 top forward into the projected 2025 top, and the 2022 low forward into the projected 2026 low.
The script also includes background cycle zones. The red-shaded regions represent the historical top-to-low bear-market windows, while the green-shaded regions represent the broader expansion and recovery phases between cycle lows and tops.
This makes it easier to visually compare where Bitcoin is now relative to prior cycle structure.
The purpose of this script is to answer one question:
**Is Bitcoin still following the old cycle, or is the cycle finally breaking?**
If the projected window continues to hold, then Bitcoin may still be moving inside a recognizable 4-year structure. If price behavior begins to diverge meaningfully from the historical rhythm, that may be evidence that the market is entering a new regime.
This script is best used on higher timeframes, especially weekly and monthly Bitcoin charts. It is not designed for short-term trading signals. It does not generate buy or sell alerts. It does not predict a specific price target. The future labels only mark projected time windows, not guaranteed outcomes.
Useful ways to use this indicator:
* Compare the current Bitcoin cycle against prior macro cycles.
* Study the timing between historical tops and lows.
* Observe whether Bitcoin is compressing, extending, or breaking its 4-year rhythm.
* Use the projected future labels as time-based reference points.
* Combine with macro liquidity, on-chain data, sentiment, trend structure, and risk models.
Important note:
The projected cycle top and cycle low should be treated as a time-map, not a prophecy. The market does not owe anyone a repeat. Patterns become fragile when everyone sees them. The value of the script is not that it guarantees the future, but that it gives traders and investors a clean framework for watching whether the old cycle continues to matter.
Bitcoin has always forced the market to question what it thinks it knows.
Maybe the 4-year cycle continues.
Maybe it shifts.
Maybe it breaks completely.
Where we go from here is a choice the market leaves to us.
This script is a simple visual roadmap for Bitcoin’s historical 4-year rhythm. It marks the major cycle tops and cycle lows that have defined Bitcoin’s previous macro cycles, then projects the next theoretical cycle points forward using the same measured cycle spacing.
The idea behind this tool is not to claim that Bitcoin must repeat the past perfectly. Markets evolve. Liquidity changes. Participants become more sophisticated. The ETF era, institutional flows, macro policy, and global adoption can all distort or even break patterns that once looked obvious.
But that is exactly why this indicator exists.
Bitcoin has spent more than a decade moving through recognizable expansion and contraction phases. Each cycle has had a major euphoric top, followed by a long bear-market drawdown and eventual accumulation low. This script takes those historical turning points and places them directly on the chart so the structure can be seen clearly.
The historical cycle labels included are:
**Cycle Tops**
* 25 Nov 2013
* 11 Dec 2017
* 08 Nov 2021
* Projected: 06 Oct 2025
**Cycle Lows**
* 12 Jan 2015
* 10 Dec 2018
* 07 Nov 2022
* Projected: 05 Oct 2026
The projected dates are based on the recurring spacing from prior Bitcoin cycle pivots. In this version, the projection uses a default 1428-day cycle spacing, which carries the 2021 top forward into the projected 2025 top, and the 2022 low forward into the projected 2026 low.
The script also includes background cycle zones. The red-shaded regions represent the historical top-to-low bear-market windows, while the green-shaded regions represent the broader expansion and recovery phases between cycle lows and tops.
This makes it easier to visually compare where Bitcoin is now relative to prior cycle structure.
The purpose of this script is to answer one question:
**Is Bitcoin still following the old cycle, or is the cycle finally breaking?**
If the projected window continues to hold, then Bitcoin may still be moving inside a recognizable 4-year structure. If price behavior begins to diverge meaningfully from the historical rhythm, that may be evidence that the market is entering a new regime.
This script is best used on higher timeframes, especially weekly and monthly Bitcoin charts. It is not designed for short-term trading signals. It does not generate buy or sell alerts. It does not predict a specific price target. The future labels only mark projected time windows, not guaranteed outcomes.
Useful ways to use this indicator:
* Compare the current Bitcoin cycle against prior macro cycles.
* Study the timing between historical tops and lows.
* Observe whether Bitcoin is compressing, extending, or breaking its 4-year rhythm.
* Use the projected future labels as time-based reference points.
* Combine with macro liquidity, on-chain data, sentiment, trend structure, and risk models.
Important note:
The projected cycle top and cycle low should be treated as a time-map, not a prophecy. The market does not owe anyone a repeat. Patterns become fragile when everyone sees them. The value of the script is not that it guarantees the future, but that it gives traders and investors a clean framework for watching whether the old cycle continues to matter.
Bitcoin has always forced the market to question what it thinks it knows.
Maybe the 4-year cycle continues.
Maybe it shifts.
Maybe it breaks completely.
Where we go from here is a choice the market leaves to us.
Phát hành các Ghi chú
Added next two cycle low and high points.
Thông báo miễn trừ trách nhiệm
Thông tin và các ấn phẩm này không nhằm mục đích, và không cấu thành, lời khuyên hoặc khuyến nghị về tài chính, đầu tư, giao dịch hay các loại khác do TradingView cung cấp hoặc xác nhận. Đọc thêm tại Điều khoản Sử dụng.
Thông báo miễn trừ trách nhiệm
Thông tin và các ấn phẩm này không nhằm mục đích, và không cấu thành, lời khuyên hoặc khuyến nghị về tài chính, đầu tư, giao dịch hay các loại khác do TradingView cung cấp hoặc xác nhận. Đọc thêm tại Điều khoản Sử dụng.