Cập nhật
Osprey Pivots
OVERVIEW
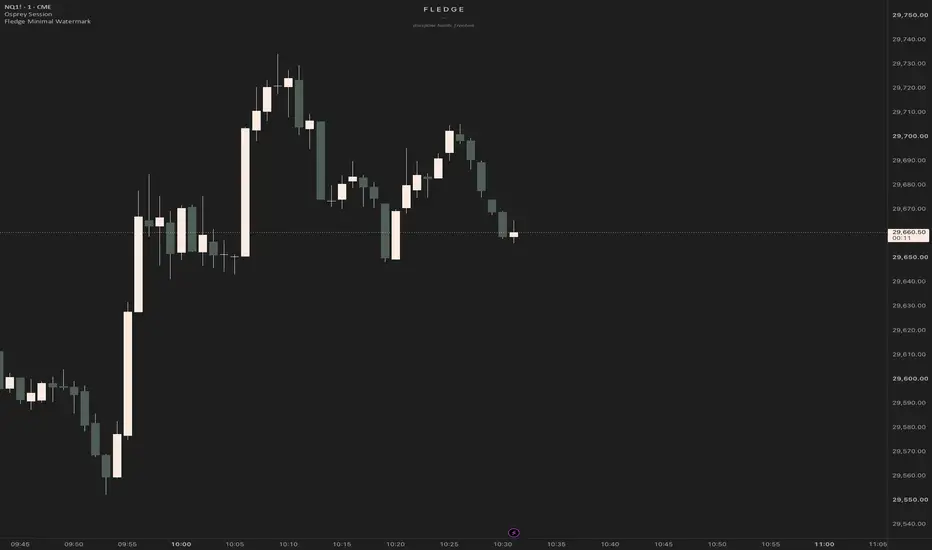
Osprey Pivots marks swing highs and swing lows based on candle direction and a price gap, instead of a fixed left/right bar lookback. It was designed for 1-minute charts but works on any timeframe and symbol. Use it on standard candlestick or bar charts.
HOW IT WORKS
A swing low "leg" can only start on a bearish candle (close < open). From there the script tracks the lowest low. If a following candle (of any color) trades lower, the running low moves to that candle. As soon as a candle closes without touching the running low, leaving a gap of at least the chosen number of ticks, that low is confirmed as the last swing low.
A swing high leg works the same way in reverse: it can only start on a bullish candle (close > open), it tracks the highest high, and it is confirmed when a candle fails to reach that high.
If no bearish candle is involved, no swing low is created (and vice versa for highs). For example, a bullish candle followed by a gap and another bullish candle confirms a high but not a low.
WHY IT IS DIFFERENT
Classic pivot functions (such as ta.pivothigh / ta.pivotlow) need a fixed number of bars on both sides, which delays the signal and ignores candle direction. This script confirms a swing as soon as price leaves a gap from the extreme, and it requires that the move started with a candle in the matching direction. The result is a faster, structure-based reading of where the last meaningful high and low are.
HOW TO USE
- The thick lines show the last confirmed high and low, extended to the right. They can be used as reference levels for structure, breaks and liquidity.
- Optionally, enable "Extend each pivot until broken" to keep every untouched pivot level on the chart; each line stops on the bar that trades through it.
- Alerts are available for "New High" and "New Low".
SETTINGS
- Minimum gap (ticks): how far a candle must stay away from the extreme to confirm it. 1 = it simply must not touch it. Increase it to filter out tiny gaps.
- Mark all pivots: shows a small triangle on every confirmed pivot.
- Show last High / Low line: shows the most recent confirmed levels.
- Extend each pivot until broken: draws a dotted line from each pivot until price breaks it.
- High color / Low color.
NOTES
- Pivots are confirmed only on bar close, so the script does not repaint. A pivot is drawn on the candle that made the extreme, one or more bars after it formed.
- Doji candles (close = open) never start a leg, but they can confirm one.
- This tool describes price structure only. It does not predict future price movement and is not a trading signal on its own.
Osprey Pivots marks swing highs and swing lows based on candle direction and a price gap, instead of a fixed left/right bar lookback. It was designed for 1-minute charts but works on any timeframe and symbol. Use it on standard candlestick or bar charts.
HOW IT WORKS
A swing low "leg" can only start on a bearish candle (close < open). From there the script tracks the lowest low. If a following candle (of any color) trades lower, the running low moves to that candle. As soon as a candle closes without touching the running low, leaving a gap of at least the chosen number of ticks, that low is confirmed as the last swing low.
A swing high leg works the same way in reverse: it can only start on a bullish candle (close > open), it tracks the highest high, and it is confirmed when a candle fails to reach that high.
If no bearish candle is involved, no swing low is created (and vice versa for highs). For example, a bullish candle followed by a gap and another bullish candle confirms a high but not a low.
WHY IT IS DIFFERENT
Classic pivot functions (such as ta.pivothigh / ta.pivotlow) need a fixed number of bars on both sides, which delays the signal and ignores candle direction. This script confirms a swing as soon as price leaves a gap from the extreme, and it requires that the move started with a candle in the matching direction. The result is a faster, structure-based reading of where the last meaningful high and low are.
HOW TO USE
- The thick lines show the last confirmed high and low, extended to the right. They can be used as reference levels for structure, breaks and liquidity.
- Optionally, enable "Extend each pivot until broken" to keep every untouched pivot level on the chart; each line stops on the bar that trades through it.
- Alerts are available for "New High" and "New Low".
SETTINGS
- Minimum gap (ticks): how far a candle must stay away from the extreme to confirm it. 1 = it simply must not touch it. Increase it to filter out tiny gaps.
- Mark all pivots: shows a small triangle on every confirmed pivot.
- Show last High / Low line: shows the most recent confirmed levels.
- Extend each pivot until broken: draws a dotted line from each pivot until price breaks it.
- High color / Low color.
NOTES
- Pivots are confirmed only on bar close, so the script does not repaint. A pivot is drawn on the candle that made the extreme, one or more bars after it formed.
- Doji candles (close = open) never start a leg, but they can confirm one.
- This tool describes price structure only. It does not predict future price movement and is not a trading signal on its own.
Phát hành các Ghi chú
- Added full marker customization, set separately for highs and lows: shape (triangle, arrow, circle, square, diamond, cross, x-cross, flag, label, text only), color, position (above/below bar or at price) and optional text.- Added a Custom marker size in points, allowing markers smaller than the Tiny preset.
- Added color, width and style settings for the last High/Low lines and the pivot rays.
- Settings are now grouped (Logic, High marker, Low marker, Lines).
- Pivot logic is unchanged.

Thông báo miễn trừ trách nhiệm
Thông tin và các ấn phẩm này không nhằm mục đích, và không cấu thành, lời khuyên hoặc khuyến nghị về tài chính, đầu tư, giao dịch hay các loại khác do TradingView cung cấp hoặc xác nhận. Đọc thêm tại Điều khoản Sử dụng.
Thông báo miễn trừ trách nhiệm
Thông tin và các ấn phẩm này không nhằm mục đích, và không cấu thành, lời khuyên hoặc khuyến nghị về tài chính, đầu tư, giao dịch hay các loại khác do TradingView cung cấp hoặc xác nhận. Đọc thêm tại Điều khoản Sử dụng.