Cập nhật
Markov Transition Matrix
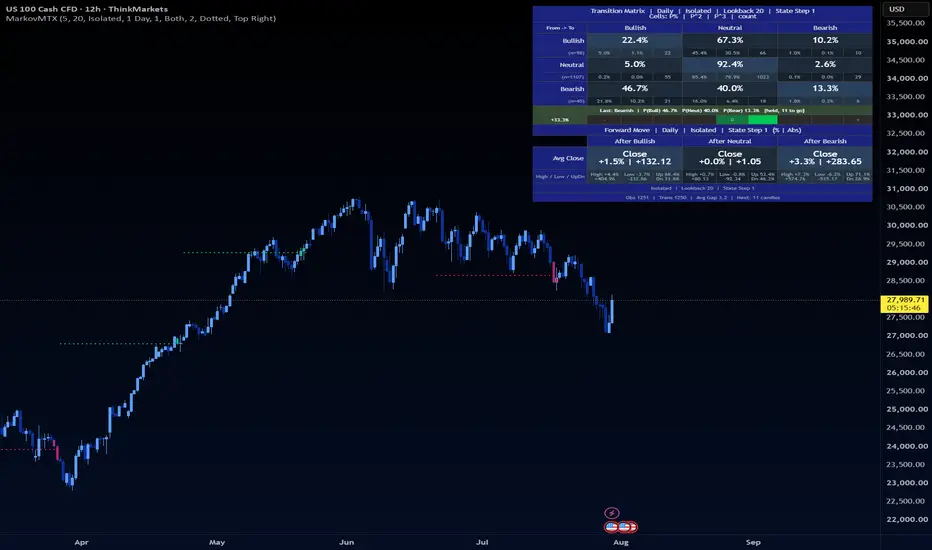
Markov Transition Matrix
This indicator classifies higher-timeframe returns into three states and then tracks how often price transitions from one state to the next.
The three states are:
The result is a 3x3 transition matrix that answers questions such as:
How It Works
What The Table Shows
Inputs
How To Read It
Usage Notes
Practical Uses
This indicator classifies higher-timeframe returns into three states and then tracks how often price transitions from one state to the next.
The three states are:
- Bullish when the N-bar return is above the selected positive threshold
- Bearish when the N-bar return is below the selected negative threshold
- Neutral when the return stays between those thresholds
The result is a 3x3 transition matrix that answers questions such as:
- After a bullish state, how often does the next state stay bullish?
- After a neutral state, how often does the next state turn bearish?
- Which current state has the strongest tendency to persist or reverse?
How It Works
- Choose an analysis timeframe.
- Choose a lookback window in candles.
- For each completed bar in that timeframe, the script computes the return from close[lookback] to the current close.
- That return is classified as Bullish, Neutral, or Bearish using the threshold input.
- Each one-step transition from the previous state to the new state is added to the cumulative matrix.
What The Table Shows
- The main value in each cell is the one-step transition probability for that row and column.
- The detail row under each cell shows P^2, P^3, and the raw transition count.
- The summary row shows the latest confirmed state plus the current row probabilities for Bullish, Neutral, and Bearish.
- The bottom bar shows a simple directional bias: P(Bull) - P(Bear).
P^2 and P^3 in this script are powers of the one-step probability. They are not full 2-step or 3-step Markov-chain forecasts produced by matrix multiplication.
Inputs
- Threshold (%): Minimum absolute return needed to classify a bar as Bullish or Bearish.
- Timeframe: Higher timeframe used for the transition analysis.
- Lookback Window: Number of candles used to measure each return.
- Table Position: Screen location of the matrix.
How To Read It
- Diagonal cells show persistence. High values there mean a state often repeats.
- Off-diagonal cells show transitions. High values there mean a state often rotates into another one.
- A positive bottom-bar reading means Bullish transitions currently outweigh Bearish transitions from the latest confirmed state.
- A negative bottom-bar reading means Bearish transitions currently outweigh Bullish transitions from the latest confirmed state.
Usage Notes
- The chart timeframe must be less than or equal to the selected analysis timeframe.
- The matrix is cumulative across all available history in the selected timeframe context.
- Changing timeframe, threshold, or lookback recompiles the script and rebuilds the tally from scratch.
- This is a state-transition study. It does not place trades or generate broker orders.
Practical Uses
- Compare persistence vs reversal behavior across different symbols.
- Test whether a market spends more time trending or mean-reverting at a chosen timeframe.
- Check whether a recent state has historically led to bullish continuation, neutral drift, or bearish follow-through.
Phát hành các Ghi chú
Markov Transition Matrix - Session UpdateThis update adds a more flexible transition model, a continuation-move panel, and live candle-state coloring. This information should be more helpful that simply knowing transitional information.
Changes In This Update
- Candle Diff was added so transitions can be measured across more than one analysis candle. A value of 1 keeps the original next-state behavior, while larger values measure state changes across a wider gap.
- The table title now reflects the selected analysis timeframe and candle difference, for example Daily 1 Candle Diff or 4h 2 Candle Diff.
- Average Move was added as a new panel beneath the matrix. It reports Bull -> Bull, Neutral -> Neutral, and Bear -> Bear continuation behavior.
- For each same-state continuation, the study now measures:
- average ending close from the origin close
- average high excursion
- average low excursion
- how often the ending close finishes up or down
- Those continuation values are shown in both percentage terms and absolute price terms.
- Display was added so users can choose to show the Transition Matrix, the Average Move panel, or Both.
- Live candle coloring was added for lower timeframes. Candles can now be colored Bullish, Neutral, or Bearish based on where the chart candle closes relative to the active higher-timeframe threshold lines.
- Color Candles was added as an on/off option.
- Custom Bull, Neutral, and Bear candle colors were added in the appearance settings.
- The input order was adjusted so Lookback Window now appears above Timeframe.
Behavior Notes
- The live candle coloring does not wait for the higher-timeframe candle to close. It uses the current threshold boundaries derived from the selected higher-timeframe reference close.
- A lower-timeframe candle only turns Bullish if it closes above the bullish threshold line.
- A lower-timeframe candle only turns Bearish if it closes below the bearish threshold line.
- If price closes between those lines, the candle remains Neutral.
Phát hành các Ghi chú
v2.0 — Window Modes: Rolling, Isolated, and Non-OverlappingThe core problem with the original version was that every measurement window shared almost all of its candles with the one before it. With a 20-day lookback, consecutive windows overlap by 19 days, so a single real move gets counted roughly 20 times. The matrix still showed useful tendencies, but the sample counts were inflated and the observations were not independent.
This update adds a Window Mode setting that lets you control how the measurement windows are spaced. It also updates the chart visualization so directional observations clearly show both the confirmed signal period and the candles used to produce it.
The three modes
- Rolling (original behavior) — A measurement is taken on every candle. Windows overlap by N-1 candles. This gives the highest sample count but the observations are autocorrelated. Nothing has changed if you leave this selected.
- Isolated — When a window classifies as Bullish or Bearish, the count restarts and no new measurement is taken until N fresh candles have printed. The next window shares zero candles with the signal window. Neutral windows keep rolling one candle at a time so the indicator stays responsive between directional events. This is the recommended mode for most users.
- Non-Overlapping — Every classification restarts the count, regardless of whether the result was Bullish, Neutral, or Bearish. This produces fully independent samples but the fewest observations.
Why Isolated is the default recommendation
If every window were forced to be non-overlapping, whether you detect a directional regime at all depends entirely on where the counting happens to start. By letting Neutral windows keep rolling, the grid aligns itself to the market rather than to an arbitrary starting bar. Directional signals anchor the reset, so the next N candles are always a clean, non-overlapping answer to "what happened after that signal."
Other changes
- The Average Move panel relabels to Forward Move in Isolated and Non-Overlapping modes. Instead of showing only same-state continuations (e.g. Bull to Bull), it shows the average move following any transition out of that state — which is the question you are actually asking when directional samples are scarce.
- A two-line footer at the bottom of the table now shows the active mode, lookback, step, observation count, transition count, average gap between observations, and how many candles remain before the next evaluation window opens.
- Candle coloring now marks confirmed directional observations only. Bullish signals use the selected Bull color and Bearish signals use the selected Bear color. Neutral observations and collection periods retain the chart's normal candle colors.
- When the chart timeframe is lower than the analysis timeframe, every chart candle contained within the confirmed directional analysis candle receives the signal color. For example, a confirmed daily signal colors all three candles on an 8-hour chart.
- Each confirmed directional observation draws a horizontal collection line across the candles used to calculate it. The line is positioned at the midpoint between the high and low of the signal candle.
- Collection lines automatically use the matching Bull or Bear color. Their size and Solid, Dashed, or Dotted style can be configured in the Appearance settings.
- The prediction row shows a "[held, N to go]" tag when the current state is being held during a cooldown period.
Settings quick reference
- Window Mode — Isolated / Non-Overlapping / Rolling (see above). Isolated is the default.
- Lookback Window — Number of candles in each measurement window (unchanged).
- Candle Diff — In Rolling mode this is the number of candles between the from-state and the to-state. In Isolated and Non-Overlapping modes this is the number of observations between them. Default 1 compares each window to the next.
- Color Candles — Enables or disables Bull/Bear coloring on confirmed directional signal candles.
- Bull / Bear — Sets the colors shared by directional signal candles and their collection lines.
- Collection Line Size / Style — Controls the width and pattern of the collection-period lines. Dotted is the default style.
Phát hành các Ghi chú
Update - Input Alignment- Appearance rows now use one short title for TradingView's automatic inline alignment. Bull/Bear sets the two directional colors in that order; Collection sets collection-line width followed by style.
- Tooltips explain the controls. Calculation modes, default values, and chart behavior are unchanged.

Thông báo miễn trừ trách nhiệm
Thông tin và các ấn phẩm này không nhằm mục đích, và không cấu thành, lời khuyên hoặc khuyến nghị về tài chính, đầu tư, giao dịch hay các loại khác do TradingView cung cấp hoặc xác nhận. Đọc thêm tại Điều khoản Sử dụng.
Thông báo miễn trừ trách nhiệm
Thông tin và các ấn phẩm này không nhằm mục đích, và không cấu thành, lời khuyên hoặc khuyến nghị về tài chính, đầu tư, giao dịch hay các loại khác do TradingView cung cấp hoặc xác nhận. Đọc thêm tại Điều khoản Sử dụng.