OPEN-SOURCE SCRIPT
Hourly Candle Open Tracker (R2F)
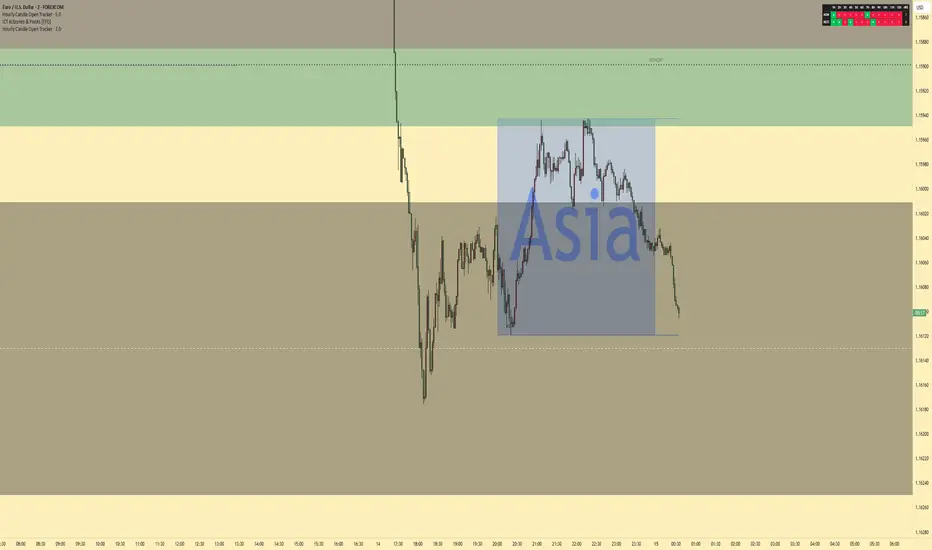
Hourly Candle Start & Formation Tracker
This indicator is designed to help traders clearly identify which hourly candle has started during the current hour, as well as which hourly candle is forming for the next hour.
The tool tracks hourly candle cycles from Hour 1 through Hour 12, making it easier to follow time-based market structure, session rhythm, and candle sequencing directly on your chart.
It provides a simple visual reference for traders who use hourly candle timing as part of their strategy, whether for entries, exits, confirmations, or observing how price behaves as each hourly candle opens and develops.
Key Features
Identifies the current hourly candle that has started
Shows which hourly candle is forming next
Covers hourly cycles from 1 to 12
Helps improve awareness of candle timing and session flow
Useful for intraday traders, scalpers, and time-based strategies
Clean and easy-to-read display directly on the chart
How It Can Be Used
This indicator can help traders stay aligned with hourly candle changes and prepare for the next candle formation before it begins. It may be useful for traders who watch specific hourly candles for volatility, reversals, continuation moves, liquidity grabs, or session-based setups.
Disclaimer
This indicator is intended for informational and educational purposes only. It does not provide buy or sell signals and should not be used as financial advice. Always combine it with your own analysis, risk management, and trading plan.
This indicator is designed to help traders clearly identify which hourly candle has started during the current hour, as well as which hourly candle is forming for the next hour.
The tool tracks hourly candle cycles from Hour 1 through Hour 12, making it easier to follow time-based market structure, session rhythm, and candle sequencing directly on your chart.
It provides a simple visual reference for traders who use hourly candle timing as part of their strategy, whether for entries, exits, confirmations, or observing how price behaves as each hourly candle opens and develops.
Key Features
Identifies the current hourly candle that has started
Shows which hourly candle is forming next
Covers hourly cycles from 1 to 12
Helps improve awareness of candle timing and session flow
Useful for intraday traders, scalpers, and time-based strategies
Clean and easy-to-read display directly on the chart
How It Can Be Used
This indicator can help traders stay aligned with hourly candle changes and prepare for the next candle formation before it begins. It may be useful for traders who watch specific hourly candles for volatility, reversals, continuation moves, liquidity grabs, or session-based setups.
Disclaimer
This indicator is intended for informational and educational purposes only. It does not provide buy or sell signals and should not be used as financial advice. Always combine it with your own analysis, risk management, and trading plan.
Mã nguồn mở
Theo đúng tinh thần TradingView, tác giả của tập lệnh này đã công bố nó dưới dạng mã nguồn mở, để các nhà giao dịch có thể xem xét và xác minh chức năng. Chúc mừng tác giả! Mặc dù bạn có thể sử dụng miễn phí, hãy nhớ rằng việc công bố lại mã phải tuân theo Nội quy.

Thông báo miễn trừ trách nhiệm
Thông tin và các ấn phẩm này không nhằm mục đích, và không cấu thành, lời khuyên hoặc khuyến nghị về tài chính, đầu tư, giao dịch hay các loại khác do TradingView cung cấp hoặc xác nhận. Đọc thêm tại Điều khoản Sử dụng.
Mã nguồn mở
Theo đúng tinh thần TradingView, tác giả của tập lệnh này đã công bố nó dưới dạng mã nguồn mở, để các nhà giao dịch có thể xem xét và xác minh chức năng. Chúc mừng tác giả! Mặc dù bạn có thể sử dụng miễn phí, hãy nhớ rằng việc công bố lại mã phải tuân theo Nội quy.
Thông báo miễn trừ trách nhiệm
Thông tin và các ấn phẩm này không nhằm mục đích, và không cấu thành, lời khuyên hoặc khuyến nghị về tài chính, đầu tư, giao dịch hay các loại khác do TradingView cung cấp hoặc xác nhận. Đọc thêm tại Điều khoản Sử dụng.