Vol Premium Gauge
If you sell options, covered calls, puts, condors, whatever, the question is always the same: am I getting paid enough?
Implied vol is what the market thinks will happen. Realized vol is what actually did. The gap between them is the insurance premium sellers collect. When it is fat, great. When it is thin or negative, you are picking up pennies in front of a steamroller.
This applies beyond vanilla options. If you run concentrated liquidity on an automated market maker you are effectively short a straddle, selling gamma in exchange for fees, and the same logic holds: you want to provide liquidity when implied vol is rich relative to realized, because that is when the fees are most likely to outpace the impermanent loss. When the premium is thin you are giving away optionality for very little.
This puts that IV versus RV relationship on your chart.
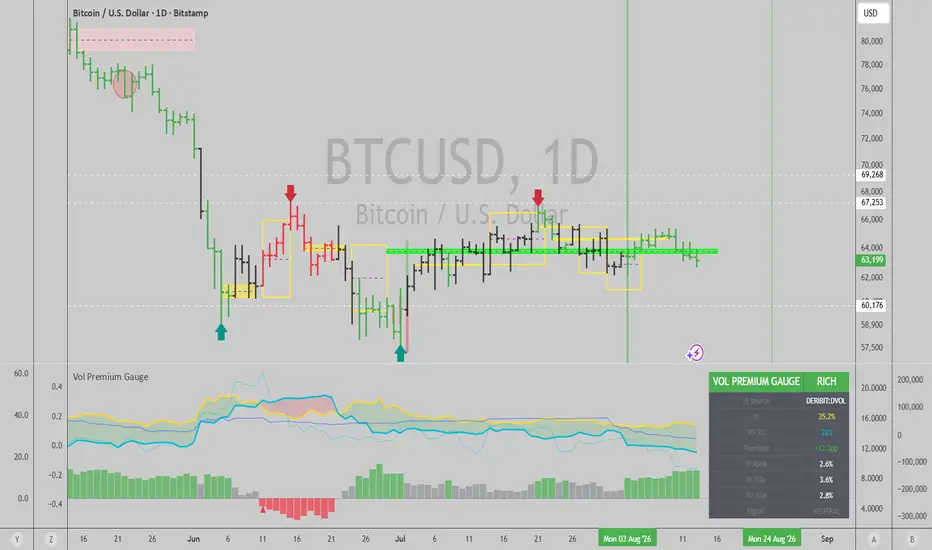
The IV line pulls a real volatility index, and only a real one: VIX on the S&P, VXN on the Nasdaq, GVZ on gold, OVX on crude, DVOL on bitcoin. The dashboard names the index it used.
If the instrument on your chart has no volatility index of its own, this reports no premium at all. That is deliberate. A premium is the gap between what the market charges and what actually happened, so estimating the first half from the second half measures your own estimator rather than the market. Realized vol still plots in three windows, fast, standard and slow, so you can see whether recent vol is spiking or compressing, and the verdict row reads RV ONLY.
An earlier version scored every non-crypto symbol against VIX, which is the implied vol of the S&P rather than of the stock in front of you. A typical single name realizes well above VIX, so the spread came out negative and it read "cheap" on nearly everything. That is fixed by refusing to guess rather than by guessing better.
The histogram is the spread, IV minus RV. Green when the premium is fat, red when thin. The filled area between the lines makes the relationship obvious at a glance, and price bars colour in the rich and cheap zones so you can read it without switching panes.
The dashboard carries IV Rank and Percentile over the trailing year. High rank plus a fat spread is the sweet spot for selling. Low rank with a thin spread means step aside. The verdict row says it plainly: SELL PREMIUM, AVOID SELLING, or NEUTRAL. Triangles mark state changes.
Implied tends to overstate realized on average, and that structural overpayment is where the money comes from. But it is not constant. Some weeks the spread is wide open, some weeks there is nothing there, and this is for telling the difference quickly.
One caveat that matters: the premium is a condition, not a timing signal. A rich premium can stay rich, and a thin one can persist for weeks. Pair it with a trend or regime read so you are not selling into a move.
Implied vol is what the market thinks will happen. Realized vol is what actually did. The gap between them is the insurance premium sellers collect. When it is fat, great. When it is thin or negative, you are picking up pennies in front of a steamroller.
This applies beyond vanilla options. If you run concentrated liquidity on an automated market maker you are effectively short a straddle, selling gamma in exchange for fees, and the same logic holds: you want to provide liquidity when implied vol is rich relative to realized, because that is when the fees are most likely to outpace the impermanent loss. When the premium is thin you are giving away optionality for very little.
This puts that IV versus RV relationship on your chart.
The IV line pulls a real volatility index, and only a real one: VIX on the S&P, VXN on the Nasdaq, GVZ on gold, OVX on crude, DVOL on bitcoin. The dashboard names the index it used.
If the instrument on your chart has no volatility index of its own, this reports no premium at all. That is deliberate. A premium is the gap between what the market charges and what actually happened, so estimating the first half from the second half measures your own estimator rather than the market. Realized vol still plots in three windows, fast, standard and slow, so you can see whether recent vol is spiking or compressing, and the verdict row reads RV ONLY.
An earlier version scored every non-crypto symbol against VIX, which is the implied vol of the S&P rather than of the stock in front of you. A typical single name realizes well above VIX, so the spread came out negative and it read "cheap" on nearly everything. That is fixed by refusing to guess rather than by guessing better.
The histogram is the spread, IV minus RV. Green when the premium is fat, red when thin. The filled area between the lines makes the relationship obvious at a glance, and price bars colour in the rich and cheap zones so you can read it without switching panes.
The dashboard carries IV Rank and Percentile over the trailing year. High rank plus a fat spread is the sweet spot for selling. Low rank with a thin spread means step aside. The verdict row says it plainly: SELL PREMIUM, AVOID SELLING, or NEUTRAL. Triangles mark state changes.
Implied tends to overstate realized on average, and that structural overpayment is where the money comes from. But it is not constant. Some weeks the spread is wide open, some weeks there is nothing there, and this is for telling the difference quickly.
One caveat that matters: the premium is a condition, not a timing signal. A rich premium can stay rich, and a thin one can persist for weeks. Pair it with a trend or regime read so you are not selling into a move.

Public, timestamped track record. Free month of the desk: ivanlabrie.netlify.app
Thông báo miễn trừ trách nhiệm
Thông tin và các ấn phẩm này không nhằm mục đích, và không cấu thành, lời khuyên hoặc khuyến nghị về tài chính, đầu tư, giao dịch hay các loại khác do TradingView cung cấp hoặc xác nhận. Đọc thêm tại Điều khoản Sử dụng.
Public, timestamped track record. Free month of the desk: ivanlabrie.netlify.app
Thông báo miễn trừ trách nhiệm
Thông tin và các ấn phẩm này không nhằm mục đích, và không cấu thành, lời khuyên hoặc khuyến nghị về tài chính, đầu tư, giao dịch hay các loại khác do TradingView cung cấp hoặc xác nhận. Đọc thêm tại Điều khoản Sử dụng.