OPEN-SOURCE SCRIPT
Cập nhật Technofunda
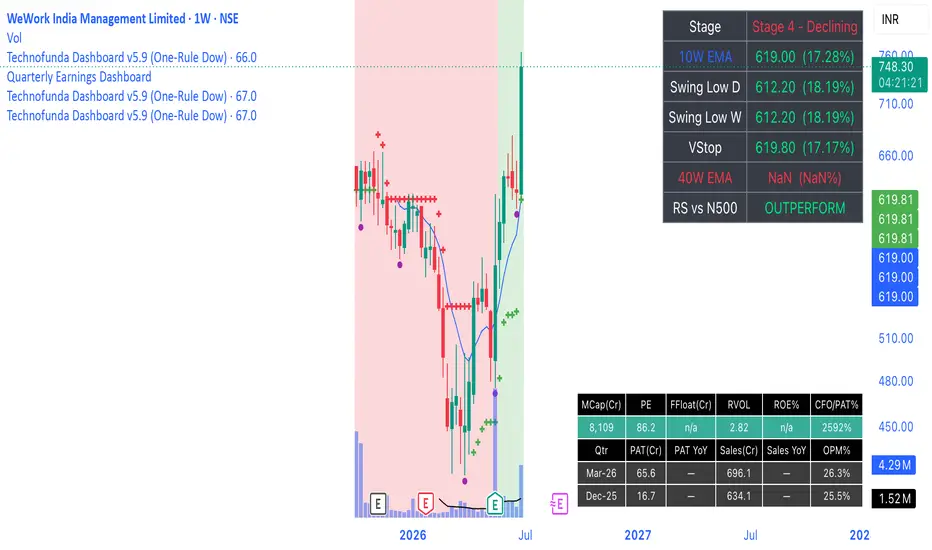
Here's what the **Technofunda Dashboard** indicator does, feature by feature:
**1. VStop (Volatility Stop) — feature 1**
ATR(20) × 2 trailing stop, plotted as dots that track price: green dots below the candles when the trend is positive (LONG), red dots above when negative (SHORT). It flips when price crosses the stop. Built with na-safe guards so it computes correctly from the start.
**2. Auto-switching moving averages — feature 5**
The indicator detects your timeframe automatically: on a daily chart it shows 21 / 50 / 200 **SMA**; on a weekly chart it switches to 10 / 20 / 40 **EMA**. Three lines — fast (aqua), medium (orange), trend (fuchsia).
**3. Distance from the MAs — feature 2**
A table (top-right) shows how far price is from each MA, measured down from price to the MA as a % of price — positive when above, negative when below, colour-coded green/red.
**4. Weinstein Stage — feature 3**
Classifies the stock into Stage 1 (Basing), 2 (Advancing), 3 (Topping) or 4 (Declining) using the long-term MA (200 DMA / 40W EMA) and its slope: price above + MA rising = Stage 2, etc. Shown in the table, colour-coded.
**5. 52-week high / low — feature 4**
Green triangle above a bar that makes a new 52-week high, red triangle below a bar that makes a new 52-week low (252 bars on daily, 52 on weekly). The table also shows current distance to the 52W high and low.
**6. Relative strength vs Nifty 500 — feature 6**
Compares the stock to a benchmark (default `NSE:CNX500`) over a lookback window. The chart background tints light green when outperforming, light red when underperforming, and the table shows OUTPERFORM / UNDERPERFORM.
**7. Per-candle letter states — feature 7**
Each candle is tagged with one letter based on its live condition:
- **A** — VStop positive (baseline / just flipped up)
- **B** — positive *and* beating Nifty 500 by ≥5%
- **C** — positive *and* beating Nifty 500 by ≥10%
- **X** — VStop negative (baseline)
- **Y** — negative *and* price below the medium MA (20W EMA / 50 DMA)
- **Z** — negative *and* price below the slow MA (40W EMA / 200 DMA)
Higher tiers win (a stock up 12% shows C, not A+B+C; one below the 40W EMA shows Z, not X+Y). The 5% / 10% thresholds are adjustable inputs.
**Extras**
A summary table consolidating MA distances, Stage, VStop status, RS status and 52W proximity; alerts for VStop flips and new 52-week highs/lows; and editable inputs for ATR length/multiplier, benchmark symbol, RS lookback, B/C thresholds, and MA slope length.
**1. VStop (Volatility Stop) — feature 1**
ATR(20) × 2 trailing stop, plotted as dots that track price: green dots below the candles when the trend is positive (LONG), red dots above when negative (SHORT). It flips when price crosses the stop. Built with na-safe guards so it computes correctly from the start.
**2. Auto-switching moving averages — feature 5**
The indicator detects your timeframe automatically: on a daily chart it shows 21 / 50 / 200 **SMA**; on a weekly chart it switches to 10 / 20 / 40 **EMA**. Three lines — fast (aqua), medium (orange), trend (fuchsia).
**3. Distance from the MAs — feature 2**
A table (top-right) shows how far price is from each MA, measured down from price to the MA as a % of price — positive when above, negative when below, colour-coded green/red.
**4. Weinstein Stage — feature 3**
Classifies the stock into Stage 1 (Basing), 2 (Advancing), 3 (Topping) or 4 (Declining) using the long-term MA (200 DMA / 40W EMA) and its slope: price above + MA rising = Stage 2, etc. Shown in the table, colour-coded.
**5. 52-week high / low — feature 4**
Green triangle above a bar that makes a new 52-week high, red triangle below a bar that makes a new 52-week low (252 bars on daily, 52 on weekly). The table also shows current distance to the 52W high and low.
**6. Relative strength vs Nifty 500 — feature 6**
Compares the stock to a benchmark (default `NSE:CNX500`) over a lookback window. The chart background tints light green when outperforming, light red when underperforming, and the table shows OUTPERFORM / UNDERPERFORM.
**7. Per-candle letter states — feature 7**
Each candle is tagged with one letter based on its live condition:
- **A** — VStop positive (baseline / just flipped up)
- **B** — positive *and* beating Nifty 500 by ≥5%
- **C** — positive *and* beating Nifty 500 by ≥10%
- **X** — VStop negative (baseline)
- **Y** — negative *and* price below the medium MA (20W EMA / 50 DMA)
- **Z** — negative *and* price below the slow MA (40W EMA / 200 DMA)
Higher tiers win (a stock up 12% shows C, not A+B+C; one below the 40W EMA shows Z, not X+Y). The 5% / 10% thresholds are adjustable inputs.
**Extras**
A summary table consolidating MA distances, Stage, VStop status, RS status and 52W proximity; alerts for VStop flips and new 52-week highs/lows; and editable inputs for ATR length/multiplier, benchmark symbol, RS lookback, B/C thresholds, and MA slope length.
Phát hành các Ghi chú
naPhát hành các Ghi chú
naPhát hành các Ghi chú
naMã nguồn mở
Theo đúng tinh thần TradingView, tác giả của tập lệnh này đã công bố nó dưới dạng mã nguồn mở, để các nhà giao dịch có thể xem xét và xác minh chức năng. Chúc mừng tác giả! Mặc dù bạn có thể sử dụng miễn phí, hãy nhớ rằng việc công bố lại mã phải tuân theo Nội quy.

Thông báo miễn trừ trách nhiệm
Thông tin và các ấn phẩm này không nhằm mục đích, và không cấu thành, lời khuyên hoặc khuyến nghị về tài chính, đầu tư, giao dịch hay các loại khác do TradingView cung cấp hoặc xác nhận. Đọc thêm tại Điều khoản Sử dụng.
Mã nguồn mở
Theo đúng tinh thần TradingView, tác giả của tập lệnh này đã công bố nó dưới dạng mã nguồn mở, để các nhà giao dịch có thể xem xét và xác minh chức năng. Chúc mừng tác giả! Mặc dù bạn có thể sử dụng miễn phí, hãy nhớ rằng việc công bố lại mã phải tuân theo Nội quy.
Thông báo miễn trừ trách nhiệm
Thông tin và các ấn phẩm này không nhằm mục đích, và không cấu thành, lời khuyên hoặc khuyến nghị về tài chính, đầu tư, giao dịch hay các loại khác do TradingView cung cấp hoặc xác nhận. Đọc thêm tại Điều khoản Sử dụng.