OPEN-SOURCE SCRIPT
Quarterly Earnings
Here's a ready-to-paste TradingView publication description:
---
**Quarterly Earnings Dashboard**
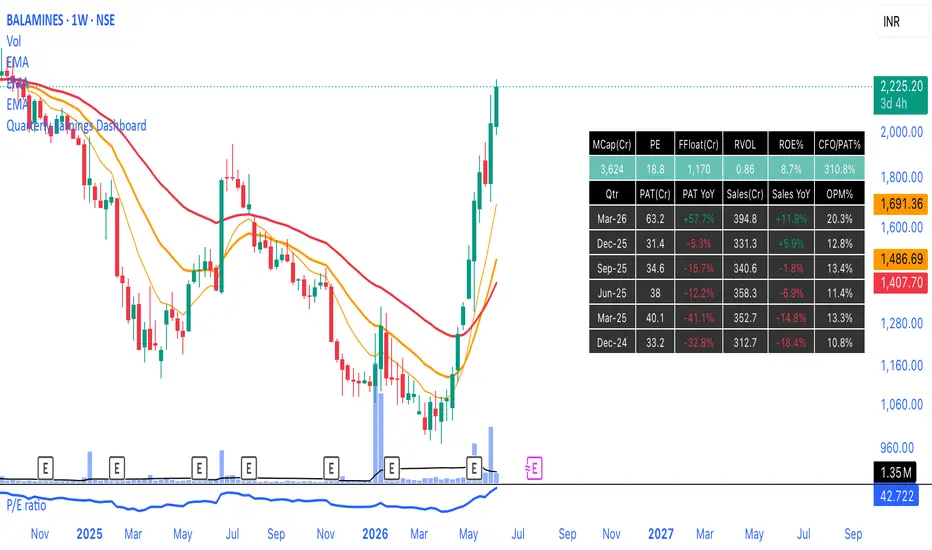
A clean on-chart table that puts a stock's key fundamentals next to its price action — built for fundamentals-aware swing/position traders who want valuation, quality, and earnings trend in one glance without leaving the chart.
**Current snapshot (top row)**
- **MCap (Cr)** — market capitalisation
- **PE** — price-to-earnings
- **FFloat (Cr)** — free-float market cap (MCap × float shares ÷ total shares)
- **RVOL** — relative volume vs the N-bar average (configurable), to spot unusual activity
- **ROE%** — return on equity
- **CFO/PAT%** — cash conversion: operating cash flow ÷ profit after tax. ~100%+ signals profits backed by real cash; persistently low is a quality red flag.
**Quarterly earnings table**
For the last N reported quarters: **PAT (Cr)**, **PAT YoY%**, **Sales (Cr)**, **Sales YoY%**, and **OPM%**. YoY columns are colour-coded green/red so accelerating or decelerating earnings jump out.
**Inputs**
- Quarters to show (1–16)
- Reporting period (FQ / FY / TTM)
- RVOL length
- Table position and colours
**Notes**
- All data is pulled from TradingView's built-in fundamentals via `request.financial()`. Best used on a single stock's weekly or daily chart.
- Some IDs (free float, cash flow) aren't published on the quarterly feed for every market, so the snapshot falls back FQ → FY → TTM. If a cell still reads "n/a", TradingView simply doesn't carry that data for the symbol.
- RVOL is relative to the chart timeframe — on a weekly chart it's volume vs the 20-week average.
Not financial advice; for research and educational use.
---
---
**Quarterly Earnings Dashboard**
A clean on-chart table that puts a stock's key fundamentals next to its price action — built for fundamentals-aware swing/position traders who want valuation, quality, and earnings trend in one glance without leaving the chart.
**Current snapshot (top row)**
- **MCap (Cr)** — market capitalisation
- **PE** — price-to-earnings
- **FFloat (Cr)** — free-float market cap (MCap × float shares ÷ total shares)
- **RVOL** — relative volume vs the N-bar average (configurable), to spot unusual activity
- **ROE%** — return on equity
- **CFO/PAT%** — cash conversion: operating cash flow ÷ profit after tax. ~100%+ signals profits backed by real cash; persistently low is a quality red flag.
**Quarterly earnings table**
For the last N reported quarters: **PAT (Cr)**, **PAT YoY%**, **Sales (Cr)**, **Sales YoY%**, and **OPM%**. YoY columns are colour-coded green/red so accelerating or decelerating earnings jump out.
**Inputs**
- Quarters to show (1–16)
- Reporting period (FQ / FY / TTM)
- RVOL length
- Table position and colours
**Notes**
- All data is pulled from TradingView's built-in fundamentals via `request.financial()`. Best used on a single stock's weekly or daily chart.
- Some IDs (free float, cash flow) aren't published on the quarterly feed for every market, so the snapshot falls back FQ → FY → TTM. If a cell still reads "n/a", TradingView simply doesn't carry that data for the symbol.
- RVOL is relative to the chart timeframe — on a weekly chart it's volume vs the 20-week average.
Not financial advice; for research and educational use.
---
Mã nguồn mở
Theo đúng tinh thần TradingView, tác giả của tập lệnh này đã công bố nó dưới dạng mã nguồn mở, để các nhà giao dịch có thể xem xét và xác minh chức năng. Chúc mừng tác giả! Mặc dù bạn có thể sử dụng miễn phí, hãy nhớ rằng việc công bố lại mã phải tuân theo Nội quy.

Thông báo miễn trừ trách nhiệm
Thông tin và các ấn phẩm này không nhằm mục đích, và không cấu thành, lời khuyên hoặc khuyến nghị về tài chính, đầu tư, giao dịch hay các loại khác do TradingView cung cấp hoặc xác nhận. Đọc thêm tại Điều khoản Sử dụng.
Mã nguồn mở
Theo đúng tinh thần TradingView, tác giả của tập lệnh này đã công bố nó dưới dạng mã nguồn mở, để các nhà giao dịch có thể xem xét và xác minh chức năng. Chúc mừng tác giả! Mặc dù bạn có thể sử dụng miễn phí, hãy nhớ rằng việc công bố lại mã phải tuân theo Nội quy.
Thông báo miễn trừ trách nhiệm
Thông tin và các ấn phẩm này không nhằm mục đích, và không cấu thành, lời khuyên hoặc khuyến nghị về tài chính, đầu tư, giao dịch hay các loại khác do TradingView cung cấp hoặc xác nhận. Đọc thêm tại Điều khoản Sử dụng.