OPEN-SOURCE SCRIPT
Maket Strat Absorption Bubbles
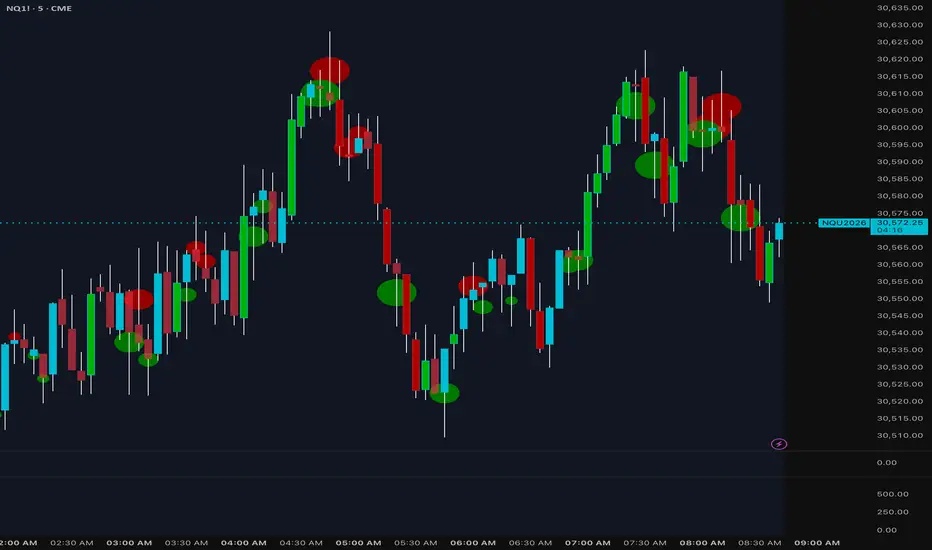
# Market Strategies Absorption Bubbles
Market Strategies Absorption Bubbles is designed to help traders identify potential absorption events where aggressive buying or selling is being absorbed by larger participants. These areas can often signal hidden liquidity, exhaustion, reversals, or important decision points within the market.
The indicator analyzes relative volume compared to historical volume activity and highlights candles where significant volume is occurring within key wick regions of the bar.
## How It Works
The script measures current volume against a normalized volume standard deviation model to identify unusually high participation.
When elevated volume is detected:
🟢 **Green Bubbles (Buying Absorption)**
* Appear in the lower wick region.
* Suggest sellers pushed price lower, but buyers absorbed the selling pressure.
* Can indicate potential support, accumulation, or reversal zones.
🔴 **Red Bubbles (Selling Absorption)**
* Appear in the upper wick region.
* Suggest buyers pushed price higher, but sellers absorbed the buying pressure.
* Can indicate potential resistance, distribution, or reversal zones.
## Bubble Strength
Bubble size increases with relative volume strength:
• Small = Elevated Volume
• Medium = Strong Volume
• Large = High Volume
• Strong = Very High Volume
• Extreme = Exceptional Volume
Larger bubbles represent greater participation and potentially more significant absorption activity.
## Heavy Volume Body Detection
The indicator also highlights candles experiencing exceptionally high volume within the candle body itself.
Bullish heavy-volume candles are colored dark green.
Bearish heavy-volume candles are colored dark red.
These candles can help traders quickly identify areas where institutional activity may be present.
## Alerts Included
✔ Buying Absorption Bubble
✔ Selling Absorption Bubble
✔ Any Absorption Bubble
Alerts trigger only on confirmed bars to reduce false signals from intrabar fluctuations.
## Best Uses
* Market Structure Analysis
* Reversal Identification
* Liquidity Sweeps
* Support & Resistance Confirmation
* Order Flow Confluence
* Auction Market Theory
* Volume-Based Trading Systems
## Market Strategies Tip
Absorption signals are most effective when combined with market structure, liquidity sweeps, VWAP, value areas, supply and demand zones, and higher timeframe directional bias. The strongest setups occur when absorption aligns with key technical levels and confirms a shift in order flow.
Built for traders who want to see where significant volume meets price rejection and where smart money may be actively defending important levels.
Market Strategies Absorption Bubbles is designed to help traders identify potential absorption events where aggressive buying or selling is being absorbed by larger participants. These areas can often signal hidden liquidity, exhaustion, reversals, or important decision points within the market.
The indicator analyzes relative volume compared to historical volume activity and highlights candles where significant volume is occurring within key wick regions of the bar.
## How It Works
The script measures current volume against a normalized volume standard deviation model to identify unusually high participation.
When elevated volume is detected:
🟢 **Green Bubbles (Buying Absorption)**
* Appear in the lower wick region.
* Suggest sellers pushed price lower, but buyers absorbed the selling pressure.
* Can indicate potential support, accumulation, or reversal zones.
🔴 **Red Bubbles (Selling Absorption)**
* Appear in the upper wick region.
* Suggest buyers pushed price higher, but sellers absorbed the buying pressure.
* Can indicate potential resistance, distribution, or reversal zones.
## Bubble Strength
Bubble size increases with relative volume strength:
• Small = Elevated Volume
• Medium = Strong Volume
• Large = High Volume
• Strong = Very High Volume
• Extreme = Exceptional Volume
Larger bubbles represent greater participation and potentially more significant absorption activity.
## Heavy Volume Body Detection
The indicator also highlights candles experiencing exceptionally high volume within the candle body itself.
Bullish heavy-volume candles are colored dark green.
Bearish heavy-volume candles are colored dark red.
These candles can help traders quickly identify areas where institutional activity may be present.
## Alerts Included
✔ Buying Absorption Bubble
✔ Selling Absorption Bubble
✔ Any Absorption Bubble
Alerts trigger only on confirmed bars to reduce false signals from intrabar fluctuations.
## Best Uses
* Market Structure Analysis
* Reversal Identification
* Liquidity Sweeps
* Support & Resistance Confirmation
* Order Flow Confluence
* Auction Market Theory
* Volume-Based Trading Systems
## Market Strategies Tip
Absorption signals are most effective when combined with market structure, liquidity sweeps, VWAP, value areas, supply and demand zones, and higher timeframe directional bias. The strongest setups occur when absorption aligns with key technical levels and confirms a shift in order flow.
Built for traders who want to see where significant volume meets price rejection and where smart money may be actively defending important levels.
Mã nguồn mở
Theo đúng tinh thần TradingView, tác giả của tập lệnh này đã công bố nó dưới dạng mã nguồn mở, để các nhà giao dịch có thể xem xét và xác minh chức năng. Chúc mừng tác giả! Mặc dù bạn có thể sử dụng miễn phí, hãy nhớ rằng việc công bố lại mã phải tuân theo Nội quy.

Thông báo miễn trừ trách nhiệm
Thông tin và các ấn phẩm này không nhằm mục đích, và không cấu thành, lời khuyên hoặc khuyến nghị về tài chính, đầu tư, giao dịch hay các loại khác do TradingView cung cấp hoặc xác nhận. Đọc thêm tại Điều khoản Sử dụng.
Mã nguồn mở
Theo đúng tinh thần TradingView, tác giả của tập lệnh này đã công bố nó dưới dạng mã nguồn mở, để các nhà giao dịch có thể xem xét và xác minh chức năng. Chúc mừng tác giả! Mặc dù bạn có thể sử dụng miễn phí, hãy nhớ rằng việc công bố lại mã phải tuân theo Nội quy.
Thông báo miễn trừ trách nhiệm
Thông tin và các ấn phẩm này không nhằm mục đích, và không cấu thành, lời khuyên hoặc khuyến nghị về tài chính, đầu tư, giao dịch hay các loại khác do TradingView cung cấp hoặc xác nhận. Đọc thêm tại Điều khoản Sử dụng.