OPEN-SOURCE SCRIPT
Cập nhật Smooths 50 Point Levels
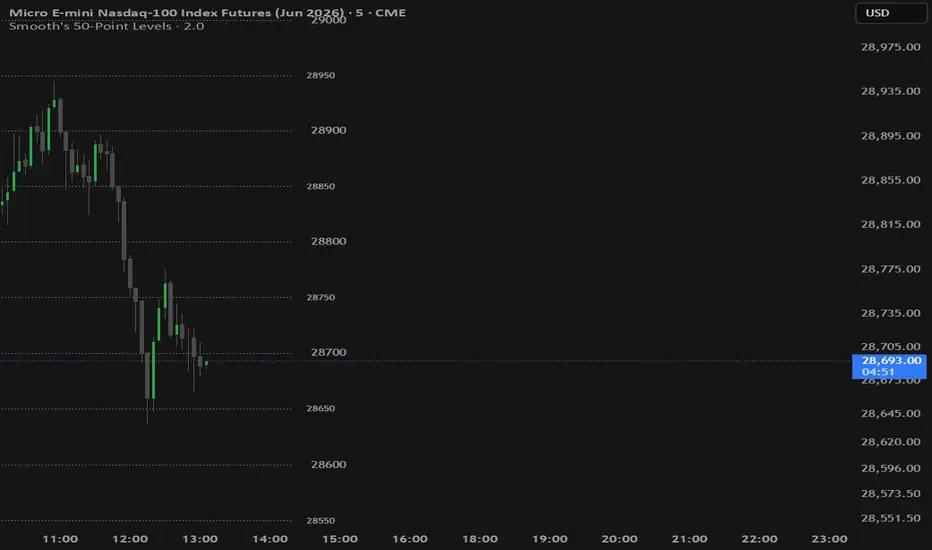
Smooth's 50-Point Levels
Overview
This indicator automatically plots horizontal price levels at every 50-point interval across the chart, centered around the current price. It is designed specifically for futures traders (NQ, ES, MNQ, MES) who use round-number price levels as key reference points for support, resistance, entries, and targets.
How It Works
The indicator calculates the nearest 50-point boundary to the current price using math.round(price / 50) * 50 as its base, then draws a configurable number of levels above and below that base. Levels are split into two distinct categories:
Round Hundreds (X00) — levels ending in 00 (e.g. 19800, 19900, 20000). These represent major psychological price levels where institutional activity and order flow tend to concentrate.
Half-Hundreds (X50) — levels ending in 50 (e.g. 19850, 19950). These act as midpoint references between the major levels, useful for identifying equilibrium zones and scalp targets.
Session Reset
Lines reset visually at a user-defined time each day (default 16:00 ET), meaning the left edge of every line anchors to that bar. This keeps the chart clean and session-specific — only showing levels relevant to the current trading session. A toggle allows lines to be extended further left for historical context.
How To Use
Use Round Hundred levels as primary support/resistance and trade targets
Use Half-Hundred levels as midpoint references and short-term scalp zones
Levels reset at 16:00 ET daily to reflect the new session's relevant price range
Adjust the number of levels displayed to match your trading range
Enable left extension when reviewing previous session price action
Customization
Each level group has independent controls for color, line style (solid/dashed/dotted), line width, label visibility, and label size. Right extension allows lines to project into future bars for forward reference.
Overview
This indicator automatically plots horizontal price levels at every 50-point interval across the chart, centered around the current price. It is designed specifically for futures traders (NQ, ES, MNQ, MES) who use round-number price levels as key reference points for support, resistance, entries, and targets.
How It Works
The indicator calculates the nearest 50-point boundary to the current price using math.round(price / 50) * 50 as its base, then draws a configurable number of levels above and below that base. Levels are split into two distinct categories:
Round Hundreds (X00) — levels ending in 00 (e.g. 19800, 19900, 20000). These represent major psychological price levels where institutional activity and order flow tend to concentrate.
Half-Hundreds (X50) — levels ending in 50 (e.g. 19850, 19950). These act as midpoint references between the major levels, useful for identifying equilibrium zones and scalp targets.
Session Reset
Lines reset visually at a user-defined time each day (default 16:00 ET), meaning the left edge of every line anchors to that bar. This keeps the chart clean and session-specific — only showing levels relevant to the current trading session. A toggle allows lines to be extended further left for historical context.
How To Use
Use Round Hundred levels as primary support/resistance and trade targets
Use Half-Hundred levels as midpoint references and short-term scalp zones
Levels reset at 16:00 ET daily to reflect the new session's relevant price range
Adjust the number of levels displayed to match your trading range
Enable left extension when reviewing previous session price action
Customization
Each level group has independent controls for color, line style (solid/dashed/dotted), line width, label visibility, and label size. Right extension allows lines to project into future bars for forward reference.
Phát hành các Ghi chú
New group added — Display ModeAdded a "Right Side Only Mode" toggle (right_mode) that switches the entire drawing behavior. When off, the indicator works exactly as originally published. When on, it switches to the floating right-side layout.
Four new inputs under this group: gap_bars (space between current bar and line start), line_length (how long the lines extend in bars), and text_gap (how many bars of space to leave on each side of the inline label).
Original Mode group
The existing Bars Right, Extend Lines Left, and Bars Left When Extended inputs were moved into their own group called "Original Mode" to keep the settings panel organized now that there are two modes.
Session Reset group
Unchanged — just clarified in the group name that it only applies to Original Mode.
Drawing logic — right mode
When right_mode is on, instead of drawing one full line per level, the script draws two half-lines with a gap between them. The left half runs from bar_index + gap_bars to the midpoint minus text_gap. The right half runs from the midpoint plus text_gap to the end. The label sits at the midpoint using label.style_label_center with a fully transparent background, making it appear inline inside the gap rather than floating above or to the side.
Drawing logic — original mode
No changes. The session reset, extend left, bars right, and label behavior are all identical to the originally published version.
Mã nguồn mở
Theo đúng tinh thần TradingView, tác giả của tập lệnh này đã công bố nó dưới dạng mã nguồn mở, để các nhà giao dịch có thể xem xét và xác minh chức năng. Chúc mừng tác giả! Mặc dù bạn có thể sử dụng miễn phí, hãy nhớ rằng việc công bố lại mã phải tuân theo Nội quy.

Thông báo miễn trừ trách nhiệm
Thông tin và các ấn phẩm này không nhằm mục đích, và không cấu thành, lời khuyên hoặc khuyến nghị về tài chính, đầu tư, giao dịch hay các loại khác do TradingView cung cấp hoặc xác nhận. Đọc thêm tại Điều khoản Sử dụng.
Mã nguồn mở
Theo đúng tinh thần TradingView, tác giả của tập lệnh này đã công bố nó dưới dạng mã nguồn mở, để các nhà giao dịch có thể xem xét và xác minh chức năng. Chúc mừng tác giả! Mặc dù bạn có thể sử dụng miễn phí, hãy nhớ rằng việc công bố lại mã phải tuân theo Nội quy.
Thông báo miễn trừ trách nhiệm
Thông tin và các ấn phẩm này không nhằm mục đích, và không cấu thành, lời khuyên hoặc khuyến nghị về tài chính, đầu tư, giao dịch hay các loại khác do TradingView cung cấp hoặc xác nhận. Đọc thêm tại Điều khoản Sử dụng.