OPEN-SOURCE SCRIPT
Dual Structure BB Ribbon (HIGH + LOW 20,2)
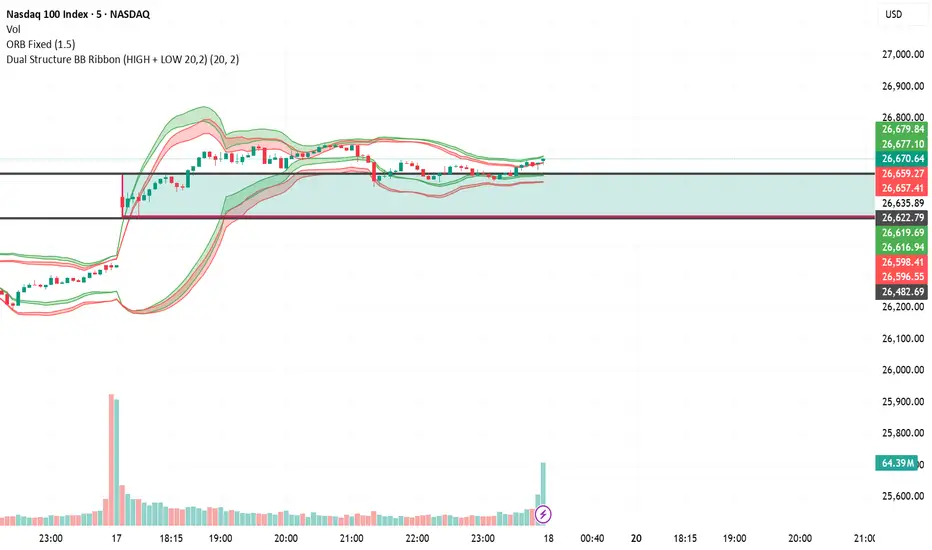
This indicator is made based on Straight Kim's strategy.
Best used in confluence with something else, on this chart you see a green box that marks the first 1hr candle high and low on NY open on Nasdaq chart - one of the easiest to trade instruments. It is not included in the indicator, just draw it yourself. It gives you the range and the BB Ribbon gives you the direction. This works on any instrument, but beginners are recommended to start with more reliable markets, one of which is NASDAQ.
The Ribbon is a structural visualization indicator that displays an advanced Bollinger Band configuration in ribbon form.
Purpose:
Merge complex Bollinger combinations into one visual structure
Intuitively separate upside vs. downside pressure
Easily recognize expansion and contraction
Clearly visualize structural transition zones
Green ribbon = buy position zones. Red ribbon = sell position zones.
This indicator is not a prediction tool — it is a visualization tool to help you read market structure more easily.
How to Use the Indicator (Trading Method)
The Ribbon is
not a standalone signal indicator.
It must be used with higher-timeframe directional bias.
Core Principles:
Only consider buys at the green ribbon
Only consider sells at the red ribbon
Never enter opposite to the ribbon color
① Trend-Following Setup
Check: 20 SMA slope (rising = uptrend, falling = downtrend), EMA slope alignment, ribbon expansion state
Uptrend → Buy at the green ribbon zone
Downtrend → Sell at the red ribbon zone
Inflection (Reversal) Setup
Conditions: Price touches outer ribbon edge, long-wick candle appears, ribbon width begins contracting
Support confirmed at green ribbon bottom → Buy
Resistance confirmed at red ribbon top → Sell
Breakout Setup
Conditions: Extreme ribbon contraction (squeeze), strong full-body candle, day high/low broken simultaneously
Green ribbon expansion breakout → Buy
Red ribbon expansion breakout → Sell
Why Buy Is Based on High and Sell Is Based on Low
Buy Ribbon → HIGH-based:
High-based calculations react more sensitively to upward movement. Even during pullbacks in an uptrend, the upper structure zone is reached faster — capturing aggressive buy entries without missing the move.
Sell Ribbon → LOW-based:
Low-based calculations reflect downward movement more loosely. Even during bounces in a downtrend, price must rise further before reaching the structure zone — forming a more conservative, stable sell entry.
1. Why Use Buy & Sell Ribbons
Traditional Bollinger Bands use a single center line with upper and lower bands. But in real markets, upward and downward pressure are not always equal. In a strong uptrend, price continuously breaks above the upper band. In a strong downtrend, price repeatedly pierces the lower band.
Simply treating "band touch = reversal" has clear limitations.
The Buy & Sell Ribbons are designed to clearly distinguish:
Zones of structural upside dominance
Zones of structural downside dominance
Expansion vs. contraction states
Trend continuation vs. potential inflection points
The Ribbon is not a mean-reversion tool — it is a visual framework for reading market structure.
Full information is publicly available here, together with the script:
florentine-pangolin-353.notion.site/Dual-Structure-BB-Ribbon-Beginner-Friendly-Educational-Manual-309590576ed480c1a071fda4fbd9dfc1
Mã nguồn mở
Theo đúng tinh thần TradingView, tác giả của tập lệnh này đã công bố nó dưới dạng mã nguồn mở, để các nhà giao dịch có thể xem xét và xác minh chức năng. Chúc mừng tác giả! Mặc dù bạn có thể sử dụng miễn phí, hãy nhớ rằng việc công bố lại mã phải tuân theo Nội quy.

Thông báo miễn trừ trách nhiệm
Thông tin và các ấn phẩm này không nhằm mục đích, và không cấu thành, lời khuyên hoặc khuyến nghị về tài chính, đầu tư, giao dịch hay các loại khác do TradingView cung cấp hoặc xác nhận. Đọc thêm tại Điều khoản Sử dụng.
Mã nguồn mở
Theo đúng tinh thần TradingView, tác giả của tập lệnh này đã công bố nó dưới dạng mã nguồn mở, để các nhà giao dịch có thể xem xét và xác minh chức năng. Chúc mừng tác giả! Mặc dù bạn có thể sử dụng miễn phí, hãy nhớ rằng việc công bố lại mã phải tuân theo Nội quy.
Thông báo miễn trừ trách nhiệm
Thông tin và các ấn phẩm này không nhằm mục đích, và không cấu thành, lời khuyên hoặc khuyến nghị về tài chính, đầu tư, giao dịch hay các loại khác do TradingView cung cấp hoặc xác nhận. Đọc thêm tại Điều khoản Sử dụng.