OPEN-SOURCE SCRIPT
MACD Structural Influx Array [KNN Engine]
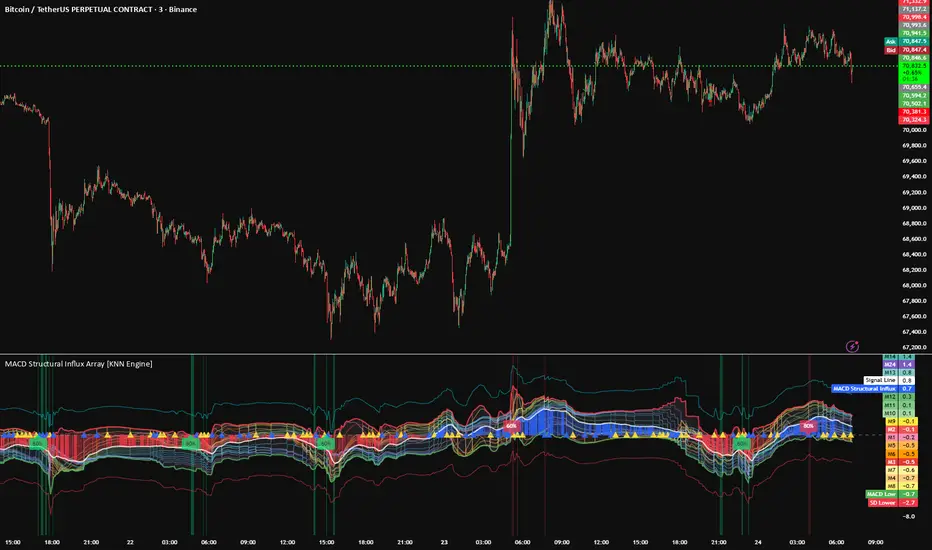
MACD Structural Influx Array [KNN Engine]
1. What the Script Does
The MACD Structural Influx Array is a high-order momentum diagnostic tool designed to identify systemic momentum exhaustion and structural mean-reversion opportunities. It moves beyond the standard Moving Average Convergence Divergence (MACD) by evaluating the absolute momentum spread across 24 simultaneous time-horizons.
Furthermore, it introduces a built-in K-Nearest Neighbors (KNN) Machine Learning Algorithm to calculate the statistical probability of a momentum-driven reversal based on historical market data.
Rather than relying on a single, arbitrary set of lookback periods (like the traditional 12 and 26), this indicator mathematically aggregates 24 distinct expanding momentum cycles to verify if the entire institutional ecosystem is structurally overextended. It visualizes this data through a dynamically scaling histogram, a multi-ribbon fan, and rolling volatility boundaries.
2. The Core Innovation: How it Calculates Everything
Standard MACD relies on fixed lookback periods, which inherently lag the market and drop relevant historical data simply because a fixed amount of time has passed. This script is fundamentally original because it abandons fixed lookbacks in favor of Anomaly Anchoring, Expanding MACD Recursion, and Predictive Classification.
Anomaly Anchoring: The engine constantly scans volume for statistical deviations. When it detects a volume spike exceeding a 2.5 Z-Score, it drops a mathematical "Anchor." It tracks the last 24 of these institutional liquidity events simultaneously.
Expanding MACD Recursion: From each of the 24 anchor points, the script begins calculating an independent MACD formula. However, instead of fixed EMAs, it calculates the spread between an Expanding Fast EMA and an Expanding Slow EMA. These dynamic alphas keep the indicator incredibly sensitive to the initial impulse of a new trend while maintaining the true memory of the anchor point.
The Consensus Meta-Mean: The script calculates the absolute average of all 24 active MACD lines. This "Meta-Mean" represents the true structural momentum equilibrium of the market. The distance of this average from zero is converted into a Z-Score, standardizing the deviation across any asset class or timeframe.
The K-Nearest Neighbors (KNN) Engine: When the script detects 100% Consensus (e.g., all 24 active MACDs are simultaneously positive or negative), it captures the exact numerical fingerprint of the market (MACD Deviation, Deviation Velocity, and Price Velocity). The KNN engine calculates the Euclidean Distance between the current fingerprint and the last 300 historical fingerprints. It finds the 5 nearest neighbors (the 5 times history looked mathematically identical) and checks their win/loss results to generate a live probability score.
3. Justifying the Methodology
Why combine 24 expanding MACD spreads with a KNN machine learning model? Because traditional momentum indicators frequently "de-anchor" during strong trends, providing false divergence signals.
By anchoring 24 separate MACD spreads to actual volume anomalies, we verify if the entire market ecosystem—from the oldest tracked institutional waves to the newest—agrees on the momentum overextension. By passing that data through a KNN algorithm, we filter out low-quality momentum traps by asking the data: "The last 5 times the structural momentum gap snapped this aggressively, did price successfully reverse by at least 0.1%?"
4. How to Use the Indicator
Visual Layout:
The Structural Fan (Ribbons): 24 individual MACD lines plotted on a standardized Z-axis. When tightly compressed, momentum is structurally unanimous. When fanned out, institutional momentum is conflicted and disarranged.
The Engine Histogram: Visualizes the standardized deviation of the Meta-Mean using a clean, standardized color baseline: Blue for bullish influx and Red for bearish influx.
Expansion (Bright): Bright Blue or Bright Red bars indicate that momentum is actively accelerating and expanding its spread.
Contraction (Dark): Dark, highly transparent bars indicate that the momentum gap is decaying or cooling off back toward the zero-line.
Tactical Trade Execution:
Spot the Momentum Purge: Watch the histogram expand into extreme territory (Bright Blue for bullish potential, Bright Red for bearish potential). This happens when price has completely disconnected from its institutional momentum baseline. Do not enter yet.
Wait for the Machine Learning Confirmation: Wait for the background to flash Lime (Bullish) or Red (Bearish) with a printed percentage (e.g., 80%). This means the KNN algorithm has verified that identical historical momentum snaps successfully reversed price.
The Trigger: Wait for the white Signal Line to peak (often printing an Exhaustion ✧ marker) and begin receding back toward the zero-line, ultimately "re-enveloping" the histogram bars. This confirms that the extreme momentum friction has officially snapped, signaling a high-probability mean reversion.
1. What the Script Does
The MACD Structural Influx Array is a high-order momentum diagnostic tool designed to identify systemic momentum exhaustion and structural mean-reversion opportunities. It moves beyond the standard Moving Average Convergence Divergence (MACD) by evaluating the absolute momentum spread across 24 simultaneous time-horizons.
Furthermore, it introduces a built-in K-Nearest Neighbors (KNN) Machine Learning Algorithm to calculate the statistical probability of a momentum-driven reversal based on historical market data.
Rather than relying on a single, arbitrary set of lookback periods (like the traditional 12 and 26), this indicator mathematically aggregates 24 distinct expanding momentum cycles to verify if the entire institutional ecosystem is structurally overextended. It visualizes this data through a dynamically scaling histogram, a multi-ribbon fan, and rolling volatility boundaries.
2. The Core Innovation: How it Calculates Everything
Standard MACD relies on fixed lookback periods, which inherently lag the market and drop relevant historical data simply because a fixed amount of time has passed. This script is fundamentally original because it abandons fixed lookbacks in favor of Anomaly Anchoring, Expanding MACD Recursion, and Predictive Classification.
Anomaly Anchoring: The engine constantly scans volume for statistical deviations. When it detects a volume spike exceeding a 2.5 Z-Score, it drops a mathematical "Anchor." It tracks the last 24 of these institutional liquidity events simultaneously.
Expanding MACD Recursion: From each of the 24 anchor points, the script begins calculating an independent MACD formula. However, instead of fixed EMAs, it calculates the spread between an Expanding Fast EMA and an Expanding Slow EMA. These dynamic alphas keep the indicator incredibly sensitive to the initial impulse of a new trend while maintaining the true memory of the anchor point.
The Consensus Meta-Mean: The script calculates the absolute average of all 24 active MACD lines. This "Meta-Mean" represents the true structural momentum equilibrium of the market. The distance of this average from zero is converted into a Z-Score, standardizing the deviation across any asset class or timeframe.
The K-Nearest Neighbors (KNN) Engine: When the script detects 100% Consensus (e.g., all 24 active MACDs are simultaneously positive or negative), it captures the exact numerical fingerprint of the market (MACD Deviation, Deviation Velocity, and Price Velocity). The KNN engine calculates the Euclidean Distance between the current fingerprint and the last 300 historical fingerprints. It finds the 5 nearest neighbors (the 5 times history looked mathematically identical) and checks their win/loss results to generate a live probability score.
3. Justifying the Methodology
Why combine 24 expanding MACD spreads with a KNN machine learning model? Because traditional momentum indicators frequently "de-anchor" during strong trends, providing false divergence signals.
By anchoring 24 separate MACD spreads to actual volume anomalies, we verify if the entire market ecosystem—from the oldest tracked institutional waves to the newest—agrees on the momentum overextension. By passing that data through a KNN algorithm, we filter out low-quality momentum traps by asking the data: "The last 5 times the structural momentum gap snapped this aggressively, did price successfully reverse by at least 0.1%?"
4. How to Use the Indicator
Visual Layout:
The Structural Fan (Ribbons): 24 individual MACD lines plotted on a standardized Z-axis. When tightly compressed, momentum is structurally unanimous. When fanned out, institutional momentum is conflicted and disarranged.
The Engine Histogram: Visualizes the standardized deviation of the Meta-Mean using a clean, standardized color baseline: Blue for bullish influx and Red for bearish influx.
Expansion (Bright): Bright Blue or Bright Red bars indicate that momentum is actively accelerating and expanding its spread.
Contraction (Dark): Dark, highly transparent bars indicate that the momentum gap is decaying or cooling off back toward the zero-line.
Tactical Trade Execution:
Spot the Momentum Purge: Watch the histogram expand into extreme territory (Bright Blue for bullish potential, Bright Red for bearish potential). This happens when price has completely disconnected from its institutional momentum baseline. Do not enter yet.
Wait for the Machine Learning Confirmation: Wait for the background to flash Lime (Bullish) or Red (Bearish) with a printed percentage (e.g., 80%). This means the KNN algorithm has verified that identical historical momentum snaps successfully reversed price.
The Trigger: Wait for the white Signal Line to peak (often printing an Exhaustion ✧ marker) and begin receding back toward the zero-line, ultimately "re-enveloping" the histogram bars. This confirms that the extreme momentum friction has officially snapped, signaling a high-probability mean reversion.
Mã nguồn mở
Theo đúng tinh thần TradingView, tác giả của tập lệnh này đã công bố nó dưới dạng mã nguồn mở, để các nhà giao dịch có thể xem xét và xác minh chức năng. Chúc mừng tác giả! Mặc dù bạn có thể sử dụng miễn phí, hãy nhớ rằng việc công bố lại mã phải tuân theo Nội quy.

Thông báo miễn trừ trách nhiệm
Thông tin và các ấn phẩm này không nhằm mục đích, và không cấu thành, lời khuyên hoặc khuyến nghị về tài chính, đầu tư, giao dịch hay các loại khác do TradingView cung cấp hoặc xác nhận. Đọc thêm tại Điều khoản Sử dụng.
Mã nguồn mở
Theo đúng tinh thần TradingView, tác giả của tập lệnh này đã công bố nó dưới dạng mã nguồn mở, để các nhà giao dịch có thể xem xét và xác minh chức năng. Chúc mừng tác giả! Mặc dù bạn có thể sử dụng miễn phí, hãy nhớ rằng việc công bố lại mã phải tuân theo Nội quy.
Thông báo miễn trừ trách nhiệm
Thông tin và các ấn phẩm này không nhằm mục đích, và không cấu thành, lời khuyên hoặc khuyến nghị về tài chính, đầu tư, giao dịch hay các loại khác do TradingView cung cấp hoặc xác nhận. Đọc thêm tại Điều khoản Sử dụng.