HL Day + StochRSI + FVG Eye [Zofesu]
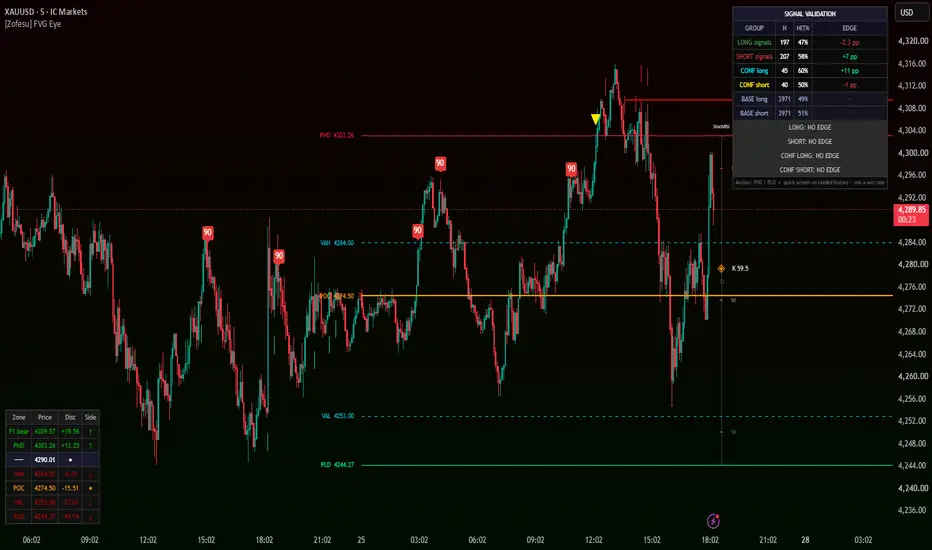
HL Day + StochRSI + FVG Eye [Zofesu] is an overlay map for intraday traders. It collects yesterday's high and low, the footprint Point of Control and Value Area, Fair Value Gaps from two timeframes and a StochRSI gauge into one chart, and lists every one of those levels in a single price-ordered ladder with its distance from the current price.
It is a map, not a signal service. The markers it draws are context. A separate engine inside the script measures whether those markers do better than ordinary bars on the same instrument — and on the defaults shipped here, on XAUUSD M5, the answer at the time of publication is NO EDGE for every group. The table shows that openly instead of hiding it.
Each building block is well known: previous-day levels, volume profile, Fair Value Gaps and Stochastic RSI are standard tools. The original part of this script is how they are put together: the StochRSI drawn as a gauge in price space between yesterday's low and high, one ladder that ranks every level by price, a one-shot confluence signal that needs both an oscillator extreme and a zone, and a built-in check of every signal group against its own random baseline.
─────────────────────────────────────
01 — What is FVG Eye?
─────────────────────────────────────
Intraday charts fill up quickly: yesterday's levels, volume levels, gaps from several timeframes, an oscillator in a separate pane. The information is there, but it is hard to see what sits directly above and below price right now.
FVG Eye draws all of it on the price chart and then answers that question in a table: which zones are above, which are below, and how far away each one is.
The oscillator stays on the price chart too. Instead of a separate pane, it is drawn as a vertical gauge next to the last candle, so you read the level map and the momentum state in one glance.
─────────────────────────────────────
02 — Previous Day Levels
─────────────────────────────────────
PHD — previous day high (red).
PLD — previous day low (green).
They are taken from the closed daily bar, so they never change during the day and are identical on history and live.
─────────────────────────────────────
03 — Footprint POC and Value Area
─────────────────────────────────────
POC — the price where the most volume traded (orange).
VAH / VAL — the upper and lower edge of the value area, where 70% of the day's volume traded (cyan, dashed).
Previous Day (Fixed) — default. Values from the last closed day. Identical on history and live.
Current Day (Live) — values develop during the day as volume builds. On history TradingView provides a day's profile only once that day has closed, so history shows each day's final profile at its last bar.
Row height is set in ticks. Rough guide: XAU 100, BTC 1000, Forex 100, Indices 10. Footprint data is not available on every TradingView plan. If it is missing, the ladder says so in its last row and the rest of the script keeps working.
─────────────────────────────────────
04 — Fair Value Gaps on Two Timeframes
─────────────────────────────────────
A Fair Value Gap is a three-candle pattern where the first and third candle do not overlap, leaving a price range that traded only in one direction.
Timeframe 1 — default 15 minutes (green / red boxes).
Timeframe 2 — default 60 minutes (blue / orange boxes).
A gap is registered only after its third candle has closed, so no box appears early and none disappears later on history.
As price trades back into a gap, the box shrinks to show only the part that is still unfilled. When the gap is completely filled, the box is removed.
Set both timeframes equal to or higher than your chart timeframe. A lower FVG timeframe cannot be read from a higher chart, so it is switched off automatically and the ladder tells you which one.
─────────────────────────────────────
05 — The StochRSI Gauge
─────────────────────────────────────
The oscillator is drawn as a vertical scale to the right of the last candle. The bottom of the scale is PLD (0), the top is PHD (100).
◈ — the K line. Its colour shows the state: red above 90, orange between 50 and 90, blue between 10 and 50, green below 10.
◇ — the D line, an average of K.
Short marks show the 90, 50 and 10 levels.
The defaults 125 / 383 / 5 / 3 are tuned for XAUUSD on the 5-minute chart and describe the higher-timeframe context rather than the last few candles. They are not universal.
How to find your own settings: add TradingView's built-in Stochastic RSI to the same chart, adjust its lengths and its upper and lower lines until the extremes mark the turns you care about, then copy those four numbers into FVG Eye. A starting point that held up across Forex and indices on the Daily chart is 14 / 42 / 5 / 3.
─────────────────────────────────────
06 — The Markers
─────────────────────────────────────
All markers are context, not entries. They appear only on closed bars.
90 / 10 labels — K crossed above 90 or below 10. The oscillator entered an extreme.
Breakout return arrows — price closed outside yesterday's range and then closed back inside it. Arrow down after a return below PHD, arrow up after a return above PLD.
Confluence triangles — an oscillator extreme and a zone line up. K crossing above 90 arms the short side, K crossing below 10 arms the long side. The armed side fires once, the first time a candle closes within 0.5 ATR of the zone (PHD or PLD by default), and then waits for a new extreme.
Long / Short Setup — K crossing back through 50 after the last extreme. These have no marker on the chart. They are available as alerts and they are counted in the validation table.
─────────────────────────────────────
07 — The Zone Ladder
─────────────────────────────────────
The table in the bottom-left corner lists every level from highest to lowest, with the current price inserted at its place.
Zone — PHD, PLD, POC, VAH, VAL, and the middle of each Fair Value Gap (F1 = Timeframe 1, F2 = Timeframe 2).
Price — the level.
Dist — distance from the current price.
Side — ↑ above price, ↓ below price, ● for the POC.
When there are more zones than the row limit, only the ones nearest to price are listed. The last row explains anything that is switched off, such as missing footprint data or an FVG timeframe below the chart timeframe.
─────────────────────────────────────
08 — Signal Validation (Quick Screen)
─────────────────────────────────────
Every signal starts a race. A target is placed 1 ATR away in the signal's direction and an opposite level 1 ATR away on the other side. Whichever price touches first decides the race. If neither is touched within 24 bars, or both are touched inside the same bar, the race is not counted.
The baseline runs exactly the same race from ordinary bars: every 5th bar without a signal starts one long and one short race. Because both sides of the race are equally far away, a market with no direction would resolve them near 50%.
Groups
LONG — Long Setup and PLD breakout return.
SHORT — Short Setup and PHD breakout return.
CONF long / CONF short — the confluence triangles.
BASE long / BASE short — the baseline. Long groups are compared with BASE long, short groups with BASE short.
Columns
N — number of decided races.
HIT% — share of races that reached the target first.
EDGE — HIT% of the group minus HIT% of its baseline, in percentage points.
Verdicts
BEATS BASELINE — the group reached its target more often than the baseline, beyond what luck explains.
WORSE THAN BASELINE — less often, beyond what luck explains.
NO EDGE — the difference is within what luck can produce.
NOT ENOUGH DATA — fewer than 30 decided races in the group or its baseline.
Why +11 pp can still be NO EDGE
EDGE shows the difference. The verdict asks whether that difference is bigger than chance could produce with this many races. Small groups swing a lot by chance, so they need a bigger difference. With about 45 races, a difference of roughly 15 pp is needed. With about 200 races, roughly 7 pp is enough.
What this screen does not do
Races that start close to each other overlap in time and share the same price move, but the screen counts them as independent. It also tests four groups at once, so one of them can look good by chance. Treat the table as a quick screen, not a final answer.
For a rigorous out-of-sample test, connect any of these signals to the separate script Signal Edge Tester [Zofesu]. The breakout return arrows and the confluence triangles can be selected directly as its source, and the Long / Short Setup through their alert conditions.
─────────────────────────────────────
09 — Settings
─────────────────────────────────────
Previous Day Levels
Show PHD / PLD — default on. Colours, line style, line width.
Footprint
Mode — default Previous Day (Fixed)
Ticks per Footprint Row — default 100
Value Area % — default 70
Show POC, Show VAH / VAL — default on. Colours and widths.
StochRSI
Show StochRSI Gauge — default on
RSI Length / Stochastic Length / K Smoothing / D Smoothing — default 125 / 383 / 5 / 3
Upper / Mid / Lower Level — default 90 / 50 / 10
Signals & Alerts
Extreme labels and breakout return arrows — default on. Hiding them does not stop the validation from counting them.
Alert switches — default on.
Zone Confluence Signals
Show confluence signals — default on
Zone anchor — default PHD / PLD. Other options: VAH / VAL, Both.
Zone tolerance — default 0.5 × ATR
Signal Validation
Show validation table — default on, Top Right, Small
Evaluation horizon — default 24 bars
ATR length — default 14
Target distance — default 1.0 × ATR
Baseline sampling interval — default every 5 bars
Minimum sample per group — default 30
Zone Dashboard
Show — default on, Bottom Left, Small
Max zones listed — default 14
FVG Timeframe 1 / Timeframe 2
Timeframe — default 15 / 60
Max bars back — default 500
Delete box after full fill — default on
Extend boxes to the right — default on
Box length when not extending — default 50 bars
Colours, border style and width.
─────────────────────────────────────
10 — How To Use
─────────────────────────────────────
Step 1 — Read the ladder first
Look at the nearest zone above and below price and how far away each one is. That is the room price has before it meets the next level.
Step 2 — Check the gauge
The gauge shows whether the oscillator is stretched (above 90 or below 10) or neutral, measured against yesterday's range.
Step 3 — Treat markers as context
A marker tells you something happened at a level. It does not tell you to enter.
Step 4 — Check the validation table on your own instrument
Open the chart you trade and read the table there. A result on XAUUSD M5 says nothing about another symbol or timeframe.
Step 5 — Adjust for other instruments and timeframes
Set the StochRSI lengths as described in section 05, the footprint row height for the instrument, and both FVG timeframes equal to or higher than the chart.
Step 6 — Test seriously before you rely on anything
If one group looks promising, test that single signal in Signal Edge Tester with a locked out-of-sample period before trusting it.
─────────────────────────────────────
11 — Limitations
─────────────────────────────────────
The publication chart shows XAUUSD M5 with all default settings. At the time of publication the validation table shows NO EDGE for all four groups.
Works on all asset classes: Indices, Forex, Gold, Oil, Stocks, Crypto.
Works on all timeframes. Default settings are tuned for XAUUSD M5.
It is a map, not a signal service. The markers it draws are context. A separate engine inside the script measures whether those markers do better than ordinary bars on the same instrument — and on the defaults shipped here, on XAUUSD M5, the answer at the time of publication is NO EDGE for every group. The table shows that openly instead of hiding it.
Each building block is well known: previous-day levels, volume profile, Fair Value Gaps and Stochastic RSI are standard tools. The original part of this script is how they are put together: the StochRSI drawn as a gauge in price space between yesterday's low and high, one ladder that ranks every level by price, a one-shot confluence signal that needs both an oscillator extreme and a zone, and a built-in check of every signal group against its own random baseline.
─────────────────────────────────────
01 — What is FVG Eye?
─────────────────────────────────────
Intraday charts fill up quickly: yesterday's levels, volume levels, gaps from several timeframes, an oscillator in a separate pane. The information is there, but it is hard to see what sits directly above and below price right now.
FVG Eye draws all of it on the price chart and then answers that question in a table: which zones are above, which are below, and how far away each one is.
The oscillator stays on the price chart too. Instead of a separate pane, it is drawn as a vertical gauge next to the last candle, so you read the level map and the momentum state in one glance.
─────────────────────────────────────
02 — Previous Day Levels
─────────────────────────────────────
PHD — previous day high (red).
PLD — previous day low (green).
They are taken from the closed daily bar, so they never change during the day and are identical on history and live.
─────────────────────────────────────
03 — Footprint POC and Value Area
─────────────────────────────────────
POC — the price where the most volume traded (orange).
VAH / VAL — the upper and lower edge of the value area, where 70% of the day's volume traded (cyan, dashed).
Previous Day (Fixed) — default. Values from the last closed day. Identical on history and live.
Current Day (Live) — values develop during the day as volume builds. On history TradingView provides a day's profile only once that day has closed, so history shows each day's final profile at its last bar.
Row height is set in ticks. Rough guide: XAU 100, BTC 1000, Forex 100, Indices 10. Footprint data is not available on every TradingView plan. If it is missing, the ladder says so in its last row and the rest of the script keeps working.
─────────────────────────────────────
04 — Fair Value Gaps on Two Timeframes
─────────────────────────────────────
A Fair Value Gap is a three-candle pattern where the first and third candle do not overlap, leaving a price range that traded only in one direction.
Timeframe 1 — default 15 minutes (green / red boxes).
Timeframe 2 — default 60 minutes (blue / orange boxes).
A gap is registered only after its third candle has closed, so no box appears early and none disappears later on history.
As price trades back into a gap, the box shrinks to show only the part that is still unfilled. When the gap is completely filled, the box is removed.
Set both timeframes equal to or higher than your chart timeframe. A lower FVG timeframe cannot be read from a higher chart, so it is switched off automatically and the ladder tells you which one.
─────────────────────────────────────
05 — The StochRSI Gauge
─────────────────────────────────────
The oscillator is drawn as a vertical scale to the right of the last candle. The bottom of the scale is PLD (0), the top is PHD (100).
◈ — the K line. Its colour shows the state: red above 90, orange between 50 and 90, blue between 10 and 50, green below 10.
◇ — the D line, an average of K.
Short marks show the 90, 50 and 10 levels.
The defaults 125 / 383 / 5 / 3 are tuned for XAUUSD on the 5-minute chart and describe the higher-timeframe context rather than the last few candles. They are not universal.
How to find your own settings: add TradingView's built-in Stochastic RSI to the same chart, adjust its lengths and its upper and lower lines until the extremes mark the turns you care about, then copy those four numbers into FVG Eye. A starting point that held up across Forex and indices on the Daily chart is 14 / 42 / 5 / 3.
─────────────────────────────────────
06 — The Markers
─────────────────────────────────────
All markers are context, not entries. They appear only on closed bars.
90 / 10 labels — K crossed above 90 or below 10. The oscillator entered an extreme.
Breakout return arrows — price closed outside yesterday's range and then closed back inside it. Arrow down after a return below PHD, arrow up after a return above PLD.
Confluence triangles — an oscillator extreme and a zone line up. K crossing above 90 arms the short side, K crossing below 10 arms the long side. The armed side fires once, the first time a candle closes within 0.5 ATR of the zone (PHD or PLD by default), and then waits for a new extreme.
Long / Short Setup — K crossing back through 50 after the last extreme. These have no marker on the chart. They are available as alerts and they are counted in the validation table.
─────────────────────────────────────
07 — The Zone Ladder
─────────────────────────────────────
The table in the bottom-left corner lists every level from highest to lowest, with the current price inserted at its place.
Zone — PHD, PLD, POC, VAH, VAL, and the middle of each Fair Value Gap (F1 = Timeframe 1, F2 = Timeframe 2).
Price — the level.
Dist — distance from the current price.
Side — ↑ above price, ↓ below price, ● for the POC.
When there are more zones than the row limit, only the ones nearest to price are listed. The last row explains anything that is switched off, such as missing footprint data or an FVG timeframe below the chart timeframe.
─────────────────────────────────────
08 — Signal Validation (Quick Screen)
─────────────────────────────────────
Every signal starts a race. A target is placed 1 ATR away in the signal's direction and an opposite level 1 ATR away on the other side. Whichever price touches first decides the race. If neither is touched within 24 bars, or both are touched inside the same bar, the race is not counted.
The baseline runs exactly the same race from ordinary bars: every 5th bar without a signal starts one long and one short race. Because both sides of the race are equally far away, a market with no direction would resolve them near 50%.
Groups
LONG — Long Setup and PLD breakout return.
SHORT — Short Setup and PHD breakout return.
CONF long / CONF short — the confluence triangles.
BASE long / BASE short — the baseline. Long groups are compared with BASE long, short groups with BASE short.
Columns
N — number of decided races.
HIT% — share of races that reached the target first.
EDGE — HIT% of the group minus HIT% of its baseline, in percentage points.
Verdicts
BEATS BASELINE — the group reached its target more often than the baseline, beyond what luck explains.
WORSE THAN BASELINE — less often, beyond what luck explains.
NO EDGE — the difference is within what luck can produce.
NOT ENOUGH DATA — fewer than 30 decided races in the group or its baseline.
Why +11 pp can still be NO EDGE
EDGE shows the difference. The verdict asks whether that difference is bigger than chance could produce with this many races. Small groups swing a lot by chance, so they need a bigger difference. With about 45 races, a difference of roughly 15 pp is needed. With about 200 races, roughly 7 pp is enough.
What this screen does not do
Races that start close to each other overlap in time and share the same price move, but the screen counts them as independent. It also tests four groups at once, so one of them can look good by chance. Treat the table as a quick screen, not a final answer.
For a rigorous out-of-sample test, connect any of these signals to the separate script Signal Edge Tester [Zofesu]. The breakout return arrows and the confluence triangles can be selected directly as its source, and the Long / Short Setup through their alert conditions.
─────────────────────────────────────
09 — Settings
─────────────────────────────────────
Previous Day Levels
Show PHD / PLD — default on. Colours, line style, line width.
Footprint
Mode — default Previous Day (Fixed)
Ticks per Footprint Row — default 100
Value Area % — default 70
Show POC, Show VAH / VAL — default on. Colours and widths.
StochRSI
Show StochRSI Gauge — default on
RSI Length / Stochastic Length / K Smoothing / D Smoothing — default 125 / 383 / 5 / 3
Upper / Mid / Lower Level — default 90 / 50 / 10
Signals & Alerts
Extreme labels and breakout return arrows — default on. Hiding them does not stop the validation from counting them.
Alert switches — default on.
Zone Confluence Signals
Show confluence signals — default on
Zone anchor — default PHD / PLD. Other options: VAH / VAL, Both.
Zone tolerance — default 0.5 × ATR
Signal Validation
Show validation table — default on, Top Right, Small
Evaluation horizon — default 24 bars
ATR length — default 14
Target distance — default 1.0 × ATR
Baseline sampling interval — default every 5 bars
Minimum sample per group — default 30
Zone Dashboard
Show — default on, Bottom Left, Small
Max zones listed — default 14
FVG Timeframe 1 / Timeframe 2
Timeframe — default 15 / 60
Max bars back — default 500
Delete box after full fill — default on
Extend boxes to the right — default on
Box length when not extending — default 50 bars
Colours, border style and width.
─────────────────────────────────────
10 — How To Use
─────────────────────────────────────
Step 1 — Read the ladder first
Look at the nearest zone above and below price and how far away each one is. That is the room price has before it meets the next level.
Step 2 — Check the gauge
The gauge shows whether the oscillator is stretched (above 90 or below 10) or neutral, measured against yesterday's range.
Step 3 — Treat markers as context
A marker tells you something happened at a level. It does not tell you to enter.
Step 4 — Check the validation table on your own instrument
Open the chart you trade and read the table there. A result on XAUUSD M5 says nothing about another symbol or timeframe.
Step 5 — Adjust for other instruments and timeframes
Set the StochRSI lengths as described in section 05, the footprint row height for the instrument, and both FVG timeframes equal to or higher than the chart.
Step 6 — Test seriously before you rely on anything
If one group looks promising, test that single signal in Signal Edge Tester with a locked out-of-sample period before trusting it.
─────────────────────────────────────
11 — Limitations
─────────────────────────────────────
- The validation table is a quick screen. It does not correct for overlapping races or for testing four groups at once.
- The numbers are built from the history your chart has loaded and change as new bars arrive. On low timeframes such as M5 they change faster than on H1 and above.
- Footprint data is not available on every TradingView plan.
- The default StochRSI settings are tuned for XAUUSD M5 and are not universal.
- With extreme validation settings (very long horizon and a baseline on every bar) the number of open races can exceed the internal limit of 500, and the oldest are dropped.
- The validation table describes the loaded history only. It does not predict how the signals will behave next.
The publication chart shows XAUUSD M5 with all default settings. At the time of publication the validation table shows NO EDGE for all four groups.
Works on all asset classes: Indices, Forex, Gold, Oil, Stocks, Crypto.
Works on all timeframes. Default settings are tuned for XAUUSD M5.

Think Act Believe. Use SL. Use BreakEven. Respect the market. Your ego and arrogance can destroy your trading account. Never leave the table unless you have a closed trade or SL/BE. Indicator does not guarantee profit.
discord.gg/FcSJpSvNnv
discord.gg/FcSJpSvNnv
Thông báo miễn trừ trách nhiệm
Thông tin và các ấn phẩm này không nhằm mục đích, và không cấu thành, lời khuyên hoặc khuyến nghị về tài chính, đầu tư, giao dịch hay các loại khác do TradingView cung cấp hoặc xác nhận. Đọc thêm tại Điều khoản Sử dụng.
Think Act Believe. Use SL. Use BreakEven. Respect the market. Your ego and arrogance can destroy your trading account. Never leave the table unless you have a closed trade or SL/BE. Indicator does not guarantee profit.
discord.gg/FcSJpSvNnv
discord.gg/FcSJpSvNnv
Thông báo miễn trừ trách nhiệm
Thông tin và các ấn phẩm này không nhằm mục đích, và không cấu thành, lời khuyên hoặc khuyến nghị về tài chính, đầu tư, giao dịch hay các loại khác do TradingView cung cấp hoặc xác nhận. Đọc thêm tại Điều khoản Sử dụng.