Cập nhật
RSI T-Bands
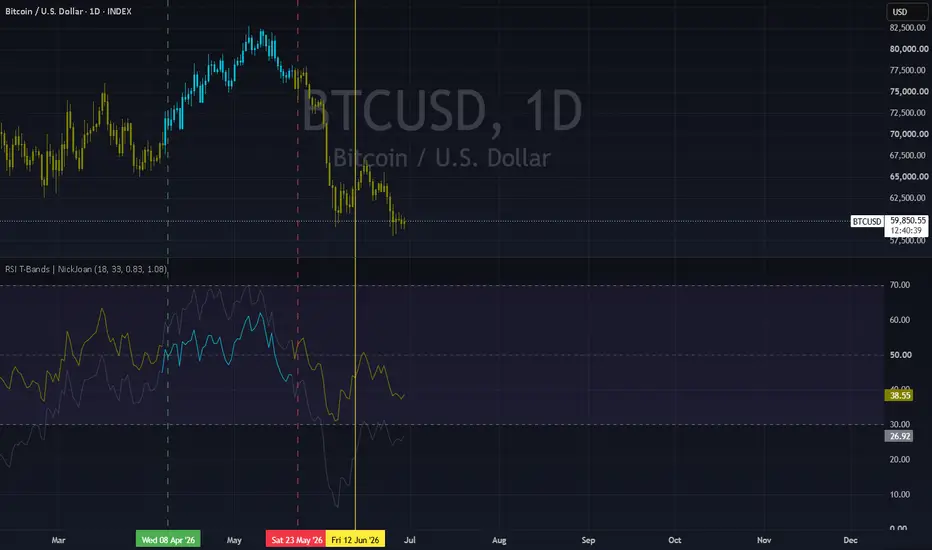
Overview
RSI T-Bands is a trend-following indicator that wraps RSI with upper and lower bands built from standard deviation. Instead of treating RSI as a simple overbought/oversold oscillator, it uses the position of these bands relative to the 50 midline to define a bullish or bearish trend state. Bands expand and contract with RSI volatility, making the indicator adaptive to changing momentum conditions.
• Bullish state: begins when the lower RSI band moves above 50.
• Bearish state: begins when the upper RSI band moves below 50
How to use
Candle coloring reflects the current trend state (green = bullish, red = bearish).
The upper and lower RSI bands act as dynamic thresholds around RSI.
The dashed 50 midline is the trend decision boundary.
Alerts
The script includes two alert conditions:
RSI T-Bands Bullish: triggers when the trend state flips from bearish to bullish.
RSI T-Bands Bearish: triggers when the trend state flips from bullish to bearish.
RSI T-Bands is a trend-following indicator that wraps RSI with upper and lower bands built from standard deviation. Instead of treating RSI as a simple overbought/oversold oscillator, it uses the position of these bands relative to the 50 midline to define a bullish or bearish trend state. Bands expand and contract with RSI volatility, making the indicator adaptive to changing momentum conditions.
• Bullish state: begins when the lower RSI band moves above 50.
• Bearish state: begins when the upper RSI band moves below 50
How to use
Candle coloring reflects the current trend state (green = bullish, red = bearish).
The upper and lower RSI bands act as dynamic thresholds around RSI.
The dashed 50 midline is the trend decision boundary.
Alerts
The script includes two alert conditions:
RSI T-Bands Bullish: triggers when the trend state flips from bearish to bullish.
RSI T-Bands Bearish: triggers when the trend state flips from bullish to bearish.
Phát hành các Ghi chú
Added separate upper and lower standard deviation multipliers.Phát hành các Ghi chú
Changed bar coloring.
Thông báo miễn trừ trách nhiệm
Thông tin và các ấn phẩm này không nhằm mục đích, và không cấu thành, lời khuyên hoặc khuyến nghị về tài chính, đầu tư, giao dịch hay các loại khác do TradingView cung cấp hoặc xác nhận. Đọc thêm tại Điều khoản Sử dụng.
Thông báo miễn trừ trách nhiệm
Thông tin và các ấn phẩm này không nhằm mục đích, và không cấu thành, lời khuyên hoặc khuyến nghị về tài chính, đầu tư, giao dịch hay các loại khác do TradingView cung cấp hoặc xác nhận. Đọc thêm tại Điều khoản Sử dụng.