OPEN-SOURCE SCRIPT
Adaptive S/R Breaks & Retests [NeBlok]
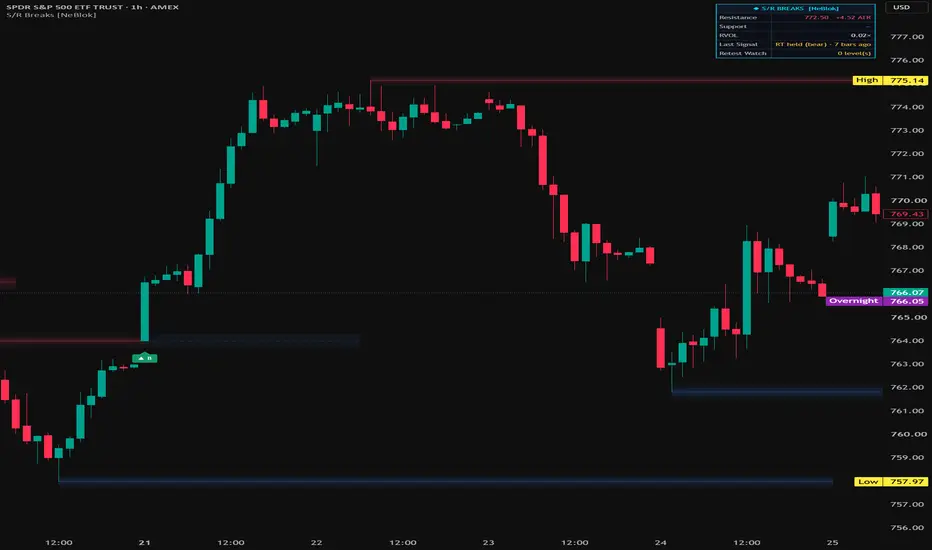
ADAPTIVE S/R BREAKS & RETESTS [NeBlok]
Most support/resistance tools stop at one question: did price break the level? This one keeps going. It grades the quality of every break, then follows the level after the break to show whether the move was confirmed by a retest, rejected as a trap, or faked out with a liquidity sweep. The goal is to help you separate real breakouts from noise, and to show you where the higher-quality entries tend to form: after the break, not during it.
━━━━━━━━━━━━━━━━━━━━━━━━━━━━━━━━
HOW IT WORKS
━━━━━━━━━━━━━━━━━━━━━━━━━━━━━━━━
1) PIVOT-BASED LEVELS AND ZONES
Swing highs become resistance (red) and swing lows become support (blue). Each level is drawn as a zone rather than a single thin line. The zone's width scales with ATR, so it adapts to the volatility of whatever market and timeframe you're on. A new swing replaces the previous live level on that side.
Each live level carries a price tag on the right showing its price and how many times it has been tested (for example, "R 642.10 ×3"). Every fresh test also makes the line visibly thicker, so heavily defended levels stand out at a glance.
2) SCORED BREAKOUTS (TIER A / B / C)
A break occurs when a candle CLOSES beyond a level (wicks alone don't count). Each break is scored on three independent factors, one point each:
- Participation: relative volume (RVOL) is above your threshold. On symbols with no volume data, such as some indices and forex pairs, the script automatically switches to a range-expansion check (candle range vs. ATR).
- Conviction: the candle has a strong body in the direction of the break, not a long-wicked indecision bar.
- Displacement: price closed a meaningful distance past the level, measured in ATR.
3 points = Tier A, 2 points = Tier B, 1 point = Tier C.
Bullish breaks print as ▲ below the bar. Bearish breaks print as ▼ above the bar. Hover over any break label to see its full scorecard: the RVOL reading, body percentage, and close distance, each marked ✓ or ✗.
3) ROLE REVERSAL: THE FLIP ZONE
When a qualified break occurs, the level doesn't simply disappear. It flips roles. Broken resistance becomes potential support (and vice versa), drawn as a dashed zone in the opposite color with a tag such as "R→S". The script then watches this flip zone for a set number of bars (the Retest Watch Window).
4) RETESTS (RT)
If price returns into the flip zone and closes back on the breakout side, an RT label prints. This shows the old level being defended in its new role. Many traders consider this the more reliable entry point compared with chasing the initial break.
5) TRAPS (TRAP)
If price instead closes back through the flip zone, a TRAP label prints. The breakout has failed, and traders who chased it are now offside. Failed breaks often lead to sharp moves in the opposite direction.
6) LIQUIDITY SWEEPS (SW)
When price wicks through a live level but closes back inside it, an SW label prints. This often marks stop-runs above resistance or below support. A sweep is not a break, and the level stays live.
7) HISTORY
Once a level is replaced, retested, trapped, or expires, it is archived and faded into the background. You keep the historical context without the clutter.
━━━━━━━━━━━━━━━━━━━━━━━━━━━━━━━━
HOW TO USE IT
━━━━━━━━━━━━━━━━━━━━━━━━━━━━━━━━
A simple workflow:
1. Note the live zones. The dashboard shows the nearest resistance and support and how far away each is in ATR, which helps you judge how much room price has to move.
2. Watch for a break and check its tier. Tier A breaks had volume, conviction, and displacement all at once. Tier C breaks passed only one test and deserve more skepticism.
3. Don't chase. Wait to see how price treats the flip zone.
4. An RT (retest held) confirms the new structure and gives a defined area to plan around. A logical invalidation sits on the far side of the flip zone.
5. A TRAP tells you the break failed. Consider standing aside, or look for opportunities in the opposite direction.
6. Use SW sweeps as context. A sweep against a strong level often shows liquidity being taken before a reversal, or before a genuine break later on.
Ideas for combining it:
- Filter signals with a higher-timeframe trend tool, and favor breaks in the direction of the larger trend.
- Raise "Minimum Tier to Signal" to B or A for fewer, higher-quality signals.
- Use the ATR distance readings in the dashboard to size stops and targets consistently across markets.
━━━━━━━━━━━━━━━━━━━━━━━━━━━━━━━━
SETTINGS GUIDE
━━━━━━━━━━━━━━━━━━━━━━━━━━━━━━━━
STRUCTURE
- Pivot Left / Right Bars (default 15 / 15): how significant a swing must be to create a level. Lower values give more, shorter-term levels; higher values give fewer, major levels. On lower timeframes, 8 to 10 is often a better starting point.
- ATR Length (default 14): the volatility measure used for zones and scoring.
- Zone Half-Width (default 0.20 × ATR): how thick each zone is. It also sets the tolerance for touches, retests, and traps.
BREAK SCORING
- Min Close-Through (default 0.05 × ATR): how far past the level a close must be to count as a break at all.
- RVOL Length / Threshold (default 20 / 1.3): the volume participation test.
- No-Volume Fallback Range (default 1.2 × ATR): used automatically when the symbol has no volume data.
- Body / Range (default 0.55): the conviction test.
- Close Beyond Level (default 0.35 × ATR): the displacement test.
- Minimum Tier to Signal (default C): breaks below this tier still end the level, but are not labeled and do not start a retest watch.
EVENTS
- Toggle Retests, Traps, and Sweeps on or off.
- Retest Watch Window (default 20 bars): how long a flip zone stays active while waiting for a retest or trap.
VISUALS
- 3D Depth Rendering: layered glow, drop shadow, and highlight on each level. Turn it off for a minimal look.
- Fade Historical Levels, Price Tags, Extend Right, Historical Levels Kept, and full color customization.
DASHBOARD
- Live resistance and support with their distance in ATR, current RVOL, the last signal and how many bars ago it occurred, and how many flip zones are currently on retest watch.
━━━━━━━━━━━━━━━━━━━━━━━━━━━━━━━━
ALERTS
━━━━━━━━━━━━━━━━━━━━━━━━━━━━━━━━
There are two ways to set alerts:
- "Any alert() function call" gives you one alert covering every event, with detailed messages that include the tier, level price, ticker, timeframe, and close.
- Individual conditions are also available: Bullish Break, Bearish Break, Retest Held, Trap (Failed Break), and Liquidity Sweep.
All alerts fire once per bar, on bar close.
━━━━━━━━━━━━━━━━━━━━━━━━━━━━━━━━
REPAINTING AND LIMITATIONS
━━━━━━━━━━━━━━━━━━━━━━━━━━━━━━━━
- Pivots can only be confirmed after the "Right Bars" count has passed. For readability, levels are drawn back to the actual swing bar, but no signal can fire until the level is confirmed. Signals are evaluated on bar close only, so once printed they do not repaint.
- Because of that confirmation delay, a level appears on the chart several bars after the swing that created it. This is a property of all pivot-based tools, not a bug.
- Volume data varies by exchange and data feed, so RVOL readings on the same asset can differ between symbols.
- No indicator is right every time. Breakouts fail, retests fail, and tiers describe the quality of a candle, not the certainty of an outcome.
━━━━━━━━━━━━━━━━━━━━━━━━━━━━━━━━
DISCLAIMER
━━━━━━━━━━━━━━━━━━━━━━━━━━━━━━━━
This script is provided free of charge for educational and informational purposes only. It is NOT financial advice, investment advice, or a recommendation to buy or sell any security, futures contract, cryptocurrency, or other financial instrument.
Trading involves substantial risk of loss and is not suitable for every investor. You can lose some or all of your capital, and leveraged products such as futures, options, and margined crypto can lose more than your initial deposit. Past performance, whether actual or backtested, does not guarantee future results. Signals shown by this indicator on historical data do not represent actual trades.
You are solely responsible for your own trading decisions. Always do your own research, use proper risk management, and consult a licensed financial professional before making investment decisions. The author and NeBlok accept no liability for any losses arising from the use of this script.
© NeBlok
Most support/resistance tools stop at one question: did price break the level? This one keeps going. It grades the quality of every break, then follows the level after the break to show whether the move was confirmed by a retest, rejected as a trap, or faked out with a liquidity sweep. The goal is to help you separate real breakouts from noise, and to show you where the higher-quality entries tend to form: after the break, not during it.
━━━━━━━━━━━━━━━━━━━━━━━━━━━━━━━━
HOW IT WORKS
━━━━━━━━━━━━━━━━━━━━━━━━━━━━━━━━
1) PIVOT-BASED LEVELS AND ZONES
Swing highs become resistance (red) and swing lows become support (blue). Each level is drawn as a zone rather than a single thin line. The zone's width scales with ATR, so it adapts to the volatility of whatever market and timeframe you're on. A new swing replaces the previous live level on that side.
Each live level carries a price tag on the right showing its price and how many times it has been tested (for example, "R 642.10 ×3"). Every fresh test also makes the line visibly thicker, so heavily defended levels stand out at a glance.
2) SCORED BREAKOUTS (TIER A / B / C)
A break occurs when a candle CLOSES beyond a level (wicks alone don't count). Each break is scored on three independent factors, one point each:
- Participation: relative volume (RVOL) is above your threshold. On symbols with no volume data, such as some indices and forex pairs, the script automatically switches to a range-expansion check (candle range vs. ATR).
- Conviction: the candle has a strong body in the direction of the break, not a long-wicked indecision bar.
- Displacement: price closed a meaningful distance past the level, measured in ATR.
3 points = Tier A, 2 points = Tier B, 1 point = Tier C.
Bullish breaks print as ▲ below the bar. Bearish breaks print as ▼ above the bar. Hover over any break label to see its full scorecard: the RVOL reading, body percentage, and close distance, each marked ✓ or ✗.
3) ROLE REVERSAL: THE FLIP ZONE
When a qualified break occurs, the level doesn't simply disappear. It flips roles. Broken resistance becomes potential support (and vice versa), drawn as a dashed zone in the opposite color with a tag such as "R→S". The script then watches this flip zone for a set number of bars (the Retest Watch Window).
4) RETESTS (RT)
If price returns into the flip zone and closes back on the breakout side, an RT label prints. This shows the old level being defended in its new role. Many traders consider this the more reliable entry point compared with chasing the initial break.
5) TRAPS (TRAP)
If price instead closes back through the flip zone, a TRAP label prints. The breakout has failed, and traders who chased it are now offside. Failed breaks often lead to sharp moves in the opposite direction.
6) LIQUIDITY SWEEPS (SW)
When price wicks through a live level but closes back inside it, an SW label prints. This often marks stop-runs above resistance or below support. A sweep is not a break, and the level stays live.
7) HISTORY
Once a level is replaced, retested, trapped, or expires, it is archived and faded into the background. You keep the historical context without the clutter.
━━━━━━━━━━━━━━━━━━━━━━━━━━━━━━━━
HOW TO USE IT
━━━━━━━━━━━━━━━━━━━━━━━━━━━━━━━━
A simple workflow:
1. Note the live zones. The dashboard shows the nearest resistance and support and how far away each is in ATR, which helps you judge how much room price has to move.
2. Watch for a break and check its tier. Tier A breaks had volume, conviction, and displacement all at once. Tier C breaks passed only one test and deserve more skepticism.
3. Don't chase. Wait to see how price treats the flip zone.
4. An RT (retest held) confirms the new structure and gives a defined area to plan around. A logical invalidation sits on the far side of the flip zone.
5. A TRAP tells you the break failed. Consider standing aside, or look for opportunities in the opposite direction.
6. Use SW sweeps as context. A sweep against a strong level often shows liquidity being taken before a reversal, or before a genuine break later on.
Ideas for combining it:
- Filter signals with a higher-timeframe trend tool, and favor breaks in the direction of the larger trend.
- Raise "Minimum Tier to Signal" to B or A for fewer, higher-quality signals.
- Use the ATR distance readings in the dashboard to size stops and targets consistently across markets.
━━━━━━━━━━━━━━━━━━━━━━━━━━━━━━━━
SETTINGS GUIDE
━━━━━━━━━━━━━━━━━━━━━━━━━━━━━━━━
STRUCTURE
- Pivot Left / Right Bars (default 15 / 15): how significant a swing must be to create a level. Lower values give more, shorter-term levels; higher values give fewer, major levels. On lower timeframes, 8 to 10 is often a better starting point.
- ATR Length (default 14): the volatility measure used for zones and scoring.
- Zone Half-Width (default 0.20 × ATR): how thick each zone is. It also sets the tolerance for touches, retests, and traps.
BREAK SCORING
- Min Close-Through (default 0.05 × ATR): how far past the level a close must be to count as a break at all.
- RVOL Length / Threshold (default 20 / 1.3): the volume participation test.
- No-Volume Fallback Range (default 1.2 × ATR): used automatically when the symbol has no volume data.
- Body / Range (default 0.55): the conviction test.
- Close Beyond Level (default 0.35 × ATR): the displacement test.
- Minimum Tier to Signal (default C): breaks below this tier still end the level, but are not labeled and do not start a retest watch.
EVENTS
- Toggle Retests, Traps, and Sweeps on or off.
- Retest Watch Window (default 20 bars): how long a flip zone stays active while waiting for a retest or trap.
VISUALS
- 3D Depth Rendering: layered glow, drop shadow, and highlight on each level. Turn it off for a minimal look.
- Fade Historical Levels, Price Tags, Extend Right, Historical Levels Kept, and full color customization.
DASHBOARD
- Live resistance and support with their distance in ATR, current RVOL, the last signal and how many bars ago it occurred, and how many flip zones are currently on retest watch.
━━━━━━━━━━━━━━━━━━━━━━━━━━━━━━━━
ALERTS
━━━━━━━━━━━━━━━━━━━━━━━━━━━━━━━━
There are two ways to set alerts:
- "Any alert() function call" gives you one alert covering every event, with detailed messages that include the tier, level price, ticker, timeframe, and close.
- Individual conditions are also available: Bullish Break, Bearish Break, Retest Held, Trap (Failed Break), and Liquidity Sweep.
All alerts fire once per bar, on bar close.
━━━━━━━━━━━━━━━━━━━━━━━━━━━━━━━━
REPAINTING AND LIMITATIONS
━━━━━━━━━━━━━━━━━━━━━━━━━━━━━━━━
- Pivots can only be confirmed after the "Right Bars" count has passed. For readability, levels are drawn back to the actual swing bar, but no signal can fire until the level is confirmed. Signals are evaluated on bar close only, so once printed they do not repaint.
- Because of that confirmation delay, a level appears on the chart several bars after the swing that created it. This is a property of all pivot-based tools, not a bug.
- Volume data varies by exchange and data feed, so RVOL readings on the same asset can differ between symbols.
- No indicator is right every time. Breakouts fail, retests fail, and tiers describe the quality of a candle, not the certainty of an outcome.
━━━━━━━━━━━━━━━━━━━━━━━━━━━━━━━━
DISCLAIMER
━━━━━━━━━━━━━━━━━━━━━━━━━━━━━━━━
This script is provided free of charge for educational and informational purposes only. It is NOT financial advice, investment advice, or a recommendation to buy or sell any security, futures contract, cryptocurrency, or other financial instrument.
Trading involves substantial risk of loss and is not suitable for every investor. You can lose some or all of your capital, and leveraged products such as futures, options, and margined crypto can lose more than your initial deposit. Past performance, whether actual or backtested, does not guarantee future results. Signals shown by this indicator on historical data do not represent actual trades.
You are solely responsible for your own trading decisions. Always do your own research, use proper risk management, and consult a licensed financial professional before making investment decisions. The author and NeBlok accept no liability for any losses arising from the use of this script.
© NeBlok
Mã nguồn mở
Theo đúng tinh thần TradingView, tác giả của tập lệnh này đã công bố nó dưới dạng mã nguồn mở, để các nhà giao dịch có thể xem xét và xác minh chức năng. Chúc mừng tác giả! Mặc dù bạn có thể sử dụng miễn phí, hãy nhớ rằng việc công bố lại mã phải tuân theo Nội quy.

Thông báo miễn trừ trách nhiệm
Thông tin và các ấn phẩm này không nhằm mục đích, và không cấu thành, lời khuyên hoặc khuyến nghị về tài chính, đầu tư, giao dịch hay các loại khác do TradingView cung cấp hoặc xác nhận. Đọc thêm tại Điều khoản Sử dụng.
Mã nguồn mở
Theo đúng tinh thần TradingView, tác giả của tập lệnh này đã công bố nó dưới dạng mã nguồn mở, để các nhà giao dịch có thể xem xét và xác minh chức năng. Chúc mừng tác giả! Mặc dù bạn có thể sử dụng miễn phí, hãy nhớ rằng việc công bố lại mã phải tuân theo Nội quy.
Thông báo miễn trừ trách nhiệm
Thông tin và các ấn phẩm này không nhằm mục đích, và không cấu thành, lời khuyên hoặc khuyến nghị về tài chính, đầu tư, giao dịch hay các loại khác do TradingView cung cấp hoặc xác nhận. Đọc thêm tại Điều khoản Sử dụng.