OPEN-SOURCE SCRIPT
Balance Point
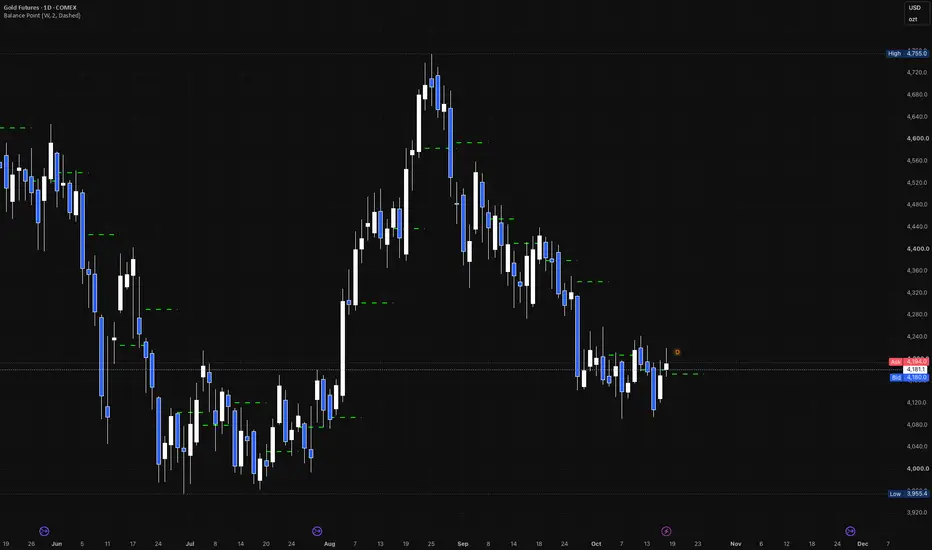
Balance Point draws the average of a higher-timeframe period's high, low and close, (H + L + C) / 3, across the following period, and projects the current period's value one period ahead.
HOW IT WORKS
Each period shows the previous period's Balance Point as a flat line. It is fixed once that period closes and never changes.
The current period's Balance Point (its high, low and close so far) is drawn one period wide to the right of the last bar, where it will apply next period. It updates live until the period closes.
HOW TO USE IT
Price above the line leans bullish for the period; below it, bearish.
A test of the line from above or below is a place to watch for support or resistance.
The projected line shows where next period's Balance Point stands right now.
INPUTS
Timeframe: the period the Balance Point is calculated on (W). The chart's own timeframe works too: each bar then shows the previous bar's value.
Line Color, Line Width, Line Style: the look of the lines (green, 2, Dashed).
DRAWING AND LIMITATIONS
Drawn only on charts at or below the chosen timeframe; on a higher chart nothing is drawn.
Past lines use closed periods only. The projected line is the current period so far and changes until the period closes.
About the last 500 periods keep their lines.
CREDITS
Balance Point as described by Robert Krausz.
Mã nguồn mở
Theo đúng tinh thần TradingView, tác giả của tập lệnh này đã công bố nó dưới dạng mã nguồn mở, để các nhà giao dịch có thể xem xét và xác minh chức năng. Chúc mừng tác giả! Mặc dù bạn có thể sử dụng miễn phí, hãy nhớ rằng việc công bố lại mã phải tuân theo Nội quy.

Thông báo miễn trừ trách nhiệm
Thông tin và các ấn phẩm này không nhằm mục đích, và không cấu thành, lời khuyên hoặc khuyến nghị về tài chính, đầu tư, giao dịch hay các loại khác do TradingView cung cấp hoặc xác nhận. Đọc thêm tại Điều khoản Sử dụng.
Mã nguồn mở
Theo đúng tinh thần TradingView, tác giả của tập lệnh này đã công bố nó dưới dạng mã nguồn mở, để các nhà giao dịch có thể xem xét và xác minh chức năng. Chúc mừng tác giả! Mặc dù bạn có thể sử dụng miễn phí, hãy nhớ rằng việc công bố lại mã phải tuân theo Nội quy.
Thông báo miễn trừ trách nhiệm
Thông tin và các ấn phẩm này không nhằm mục đích, và không cấu thành, lời khuyên hoặc khuyến nghị về tài chính, đầu tư, giao dịch hay các loại khác do TradingView cung cấp hoặc xác nhận. Đọc thêm tại Điều khoản Sử dụng.