Institutional Asset Quality Radar [BigBeluga]
More exclusive indicators from BigBeluga
Subscribe to BigBeluga Premium for $66.47/month to get exclusive indicators by this author. You pay right on TradingView and can use them on your charts straight away.
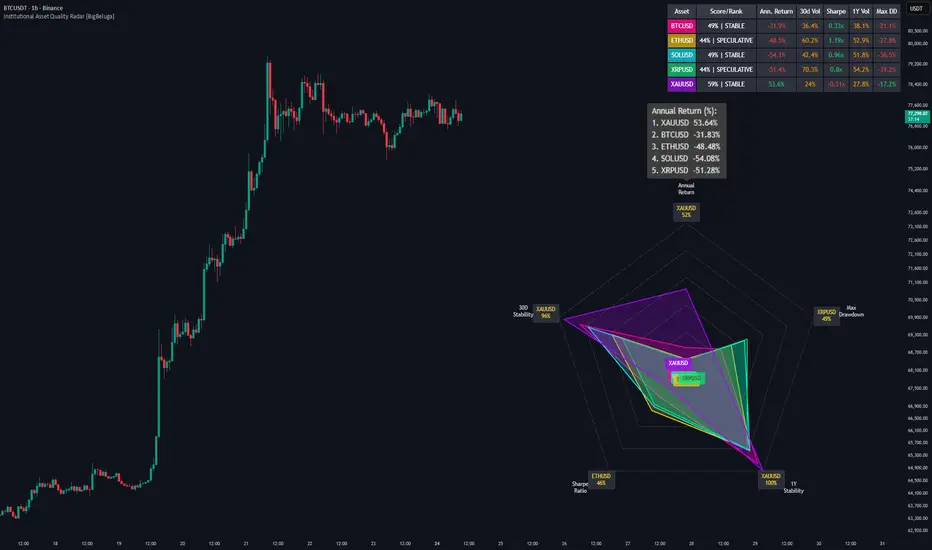
Explore BigBeluga PremiumInstitutional Asset Quality Radar [BigBeluga] is a high-performance multi-asset diagnostic tool designed to visualize the structural health and risk-adjusted performance of up to five assets simultaneously. By projecting institutional-grade metrics into a dynamic radar geometry, the indicator allows traders to compare the "DNA" of different symbols beyond simple price action.
The goal is to provide a multi-dimensional view of quality—identifying which assets are fundamentally robust and which are driven by high-risk volatility.
🔵 CONCEPTS
The indicator evaluates assets across five core pillars, each normalized to a 0–100 score.
The Radar (Spider) Chart represents these scores as a polygon; a larger, more symmetrical shape indicates a well-rounded, high-quality asset, while a "pinched" or narrow shape reveals specific structural weaknesses.
To ensure the UI remains clean, the radar uses a non-scaling overlay and an advanced rendering engine that manages drawings dynamically, preventing "ghosting" or chart clutter.
🔵 THE FIVE PILLARS OF ASSET QUALITY
At the core of the radar are five performance dimensions used by institutional fund managers to assess portfolio components.

Each axis label is interactive—hovering over a label (e.g., "Max Drawdown") will reveal a ranked tooltip showing the specific performance values for all selected assets in that category.

🔵 THE INSTITUTIONAL DASHBOARD
Complementing the visual radar is a high-density Performance Dashboard that provides a granular breakdown of each asset's status.

🔵 FEATURES
🔵 HOW TO USE
🔵 CONCLUSION
Institutional Asset Quality Radar [BigBeluga] transforms abstract financial data into a tangible geometric form. By visualizing the relationship between return, risk, and efficiency, the indicator helps traders move beyond "price-only" analysis and focus on assets with the highest structural integrity.
The goal is to provide a multi-dimensional view of quality—identifying which assets are fundamentally robust and which are driven by high-risk volatility.
🔵 CONCEPTS
The indicator evaluates assets across five core pillars, each normalized to a 0–100 score.
The Radar (Spider) Chart represents these scores as a polygon; a larger, more symmetrical shape indicates a well-rounded, high-quality asset, while a "pinched" or narrow shape reveals specific structural weaknesses.
To ensure the UI remains clean, the radar uses a non-scaling overlay and an advanced rendering engine that manages drawings dynamically, preventing "ghosting" or chart clutter.
🔵 THE FIVE PILLARS OF ASSET QUALITY
At the core of the radar are five performance dimensions used by institutional fund managers to assess portfolio components.
- Annual Return: Measures the raw growth of the asset over a 365-day period.
- 30d Stability: The inverse of short-term volatility. Higher scores mean smoother, more predictable price action.
- Sharpe Ratio: Measures risk-adjusted return. It answers: "Is the profit worth the stress?"
- 1Y Stability: The inverse of long-term volatility, identifying assets with consistent structural integrity.
- Max Drawdown: Evaluates the "pain factor" by measuring the largest peak-to-trough decline over the past year.
Each axis label is interactive—hovering over a label (e.g., "Max Drawdown") will reveal a ranked tooltip showing the specific performance values for all selected assets in that category.
🔵 THE INSTITUTIONAL DASHBOARD
Complementing the visual radar is a high-density Performance Dashboard that provides a granular breakdown of each asset's status.
- Asset Classification: Automatically categorizes assets into PREMIUM (High efficiency), STABLE (Reliable), or SPECULATIVE (High risk) based on their aggregate score.
- Real-Time Ranking: Hovering over the axis labels on the chart triggers tooltips that show a ranked list (1st to 5th place) for that specific metric.
- Color-Coded Analytics: The table highlights returns, stability, and drawdown using color thresholds to immediately flag underperforming or high-risk assets.
🔵 FEATURES
- Horizontal Offset Control
You can now shift the entire radar left or right using the "Horizontal Offset" input. This allows you to push the radar into the "future" (the empty space to the right of the current bar) to keep your candles unobstructed. - Long-Term Scale Smoothing
The radar now uses a 100-period ATR calculation for its vertical scaling. This ensures the radar shape remains stable and consistent even during sudden, short-term price spikes. - Optimized Rendering Engine
The tool now utilizes an array-based drawing management system. It clears and redrawn only on the most recent bar, ensuring maximum performance and a flicker-free experience. - Best-in-Axis Identification
Automatically identifies and labels the "Winner" of each category at the tip of the radar axes in real-time. - Centroid Labeling
Calculates the mathematical center of each asset's polygon to place ticker labels, ensuring they are always readable even when multiple assets overlap.
🔵 HOW TO USE
- Identify Relative Strength: Look for assets with a large "reach" toward the Annual Return and Sharpe axes while maintaining a wide base in Stability.
- Spot Risk Outliers: An asset with a high return but a very low Max Drawdown score is a "momentum trap" that may be prone to violent reversals.
- Portfolio Rebalancing: Use the dashboard to monitor when a "Premium" asset begins to decay into "Speculative" territory as its Sharpe ratio drops or volatility expands.
- Benchmark Comparison: Load a benchmark (like BTC or SPY) as Asset 1 to see how other altcoins or stocks perform relative to the market leader.
🔵 CONCLUSION
Institutional Asset Quality Radar [BigBeluga] transforms abstract financial data into a tangible geometric form. By visualizing the relationship between return, risk, and efficiency, the indicator helps traders move beyond "price-only" analysis and focus on assets with the highest structural integrity.

🌐 bigbeluga.org/tv - Get access to our powerful tools & indicators.
🔵 Learn More -> docs.bigbeluga.org/
🔵 Join Discord -> go.bigbeluga.org/k65q9bfqfu
All content provided by BigBeluga is for educational purposes only
🔵 Learn More -> docs.bigbeluga.org/
🔵 Join Discord -> go.bigbeluga.org/k65q9bfqfu
All content provided by BigBeluga is for educational purposes only
Thông báo miễn trừ trách nhiệm
Thông tin và các ấn phẩm này không nhằm mục đích, và không cấu thành, lời khuyên hoặc khuyến nghị về tài chính, đầu tư, giao dịch hay các loại khác do TradingView cung cấp hoặc xác nhận. Đọc thêm tại Điều khoản Sử dụng.
🌐 bigbeluga.org/tv - Get access to our powerful tools & indicators.
🔵 Learn More -> docs.bigbeluga.org/
🔵 Join Discord -> go.bigbeluga.org/k65q9bfqfu
All content provided by BigBeluga is for educational purposes only
🔵 Learn More -> docs.bigbeluga.org/
🔵 Join Discord -> go.bigbeluga.org/k65q9bfqfu
All content provided by BigBeluga is for educational purposes only
Thông báo miễn trừ trách nhiệm
Thông tin và các ấn phẩm này không nhằm mục đích, và không cấu thành, lời khuyên hoặc khuyến nghị về tài chính, đầu tư, giao dịch hay các loại khác do TradingView cung cấp hoặc xác nhận. Đọc thêm tại Điều khoản Sử dụng.