OPEN-SOURCE SCRIPT
Volume vs MA20 Multiple
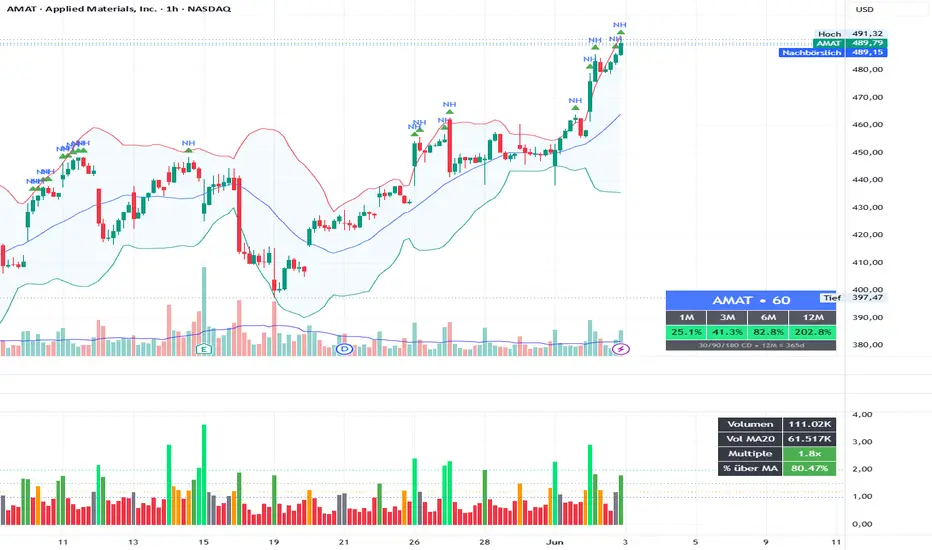
Volume vs MA20 Multiple
This indicator shows how the current candle’s volume compares to its moving average volume.
Instead of only displaying raw volume, it calculates a volume multiple relative to the selected volume moving average, for example:
The default setting uses a 20-period volume moving average, which means:
This makes it easier to judge whether a breakout, reversal, or pullback move is supported by meaningful volume.
How I use it
For breakout trades, I usually want to see price breaking above a key level while volume is clearly above average.
Typical interpretation:
The indicator can display both the multiple and the percentage above the moving average, making it useful for quickly validating whether a price move has real participation behind it.
This indicator is not a standalone buy or sell signal. It is intended to be used together with price action, support/resistance, trend structure, and risk management.
This indicator shows how the current candle’s volume compares to its moving average volume.
Instead of only displaying raw volume, it calculates a volume multiple relative to the selected volume moving average, for example:
- 1.0x = current volume equals the volume moving average
- 1.2x = current volume is 20% above average
- 1.5x = current volume is 50% above average
- 2.0x = current volume is twice the average volume
The default setting uses a 20-period volume moving average, which means:
- on the 1H chart, it compares the current hourly volume to the average of the last 20 hourly candles
- on the daily chart, it compares the current daily volume to the average of the last 20 daily candles
- on any timeframe, it automatically adapts to the selected chart timeframe
This makes it easier to judge whether a breakout, reversal, or pullback move is supported by meaningful volume.
How I use it
For breakout trades, I usually want to see price breaking above a key level while volume is clearly above average.
Typical interpretation:
- Below 1.0x: weak / below-average volume
- Around 1.0x: normal volume
- 1.2x – 1.5x: increased volume, potential confirmation
- 1.5x – 2.0x: strong volume confirmation
- Above 2.0x: very strong participation
The indicator can display both the multiple and the percentage above the moving average, making it useful for quickly validating whether a price move has real participation behind it.
- Best used for
- Breakout confirmation
- Pullback entries
- Reversal setups
- Intraday momentum analysis
- Comparing volume strength across different timeframes
This indicator is not a standalone buy or sell signal. It is intended to be used together with price action, support/resistance, trend structure, and risk management.
Mã nguồn mở
Theo đúng tinh thần TradingView, tác giả của tập lệnh này đã công bố nó dưới dạng mã nguồn mở, để các nhà giao dịch có thể xem xét và xác minh chức năng. Chúc mừng tác giả! Mặc dù bạn có thể sử dụng miễn phí, hãy nhớ rằng việc công bố lại mã phải tuân theo Nội quy.

Thông báo miễn trừ trách nhiệm
Thông tin và các ấn phẩm này không nhằm mục đích, và không cấu thành, lời khuyên hoặc khuyến nghị về tài chính, đầu tư, giao dịch hay các loại khác do TradingView cung cấp hoặc xác nhận. Đọc thêm tại Điều khoản Sử dụng.
Mã nguồn mở
Theo đúng tinh thần TradingView, tác giả của tập lệnh này đã công bố nó dưới dạng mã nguồn mở, để các nhà giao dịch có thể xem xét và xác minh chức năng. Chúc mừng tác giả! Mặc dù bạn có thể sử dụng miễn phí, hãy nhớ rằng việc công bố lại mã phải tuân theo Nội quy.
Thông báo miễn trừ trách nhiệm
Thông tin và các ấn phẩm này không nhằm mục đích, và không cấu thành, lời khuyên hoặc khuyến nghị về tài chính, đầu tư, giao dịch hay các loại khác do TradingView cung cấp hoặc xác nhận. Đọc thêm tại Điều khoản Sử dụng.