Cập nhật
MTF Equals v1.0
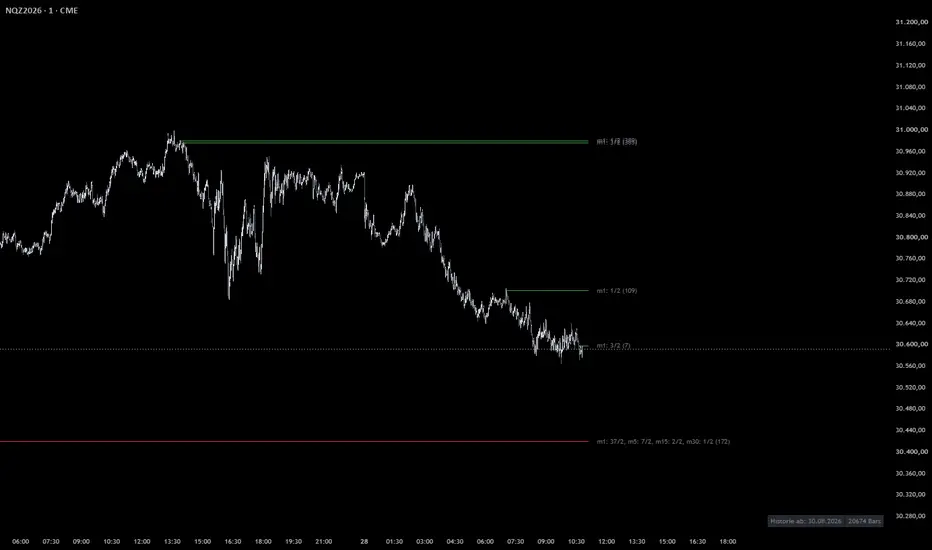
MTF Equals is a professional-grade tool designed to identify significant price levels across multiple timeframes. It scans the current chart and higher timeframes (HTF) for identical highs and lows ("Equals"), which often act as price magnets or liquidity pools.
Key Features:
Multi-Timeframe Analysis: Automatically detects identical highs and lows on the current chart, as well as M5, M15, M30, H1, H4, and Daily.
NQ Auto-Detection: Specialized logic for Nasdaq (NQ) that automatically determines the ideal starting point for analysis based on volume, efficiency, and price density.
Live Statistics: Displays the number of touches and the bar distance from the first touchpoint directly on the price level.
Smart Cleaning: Levels are automatically removed once they are significantly breached by price, keeping your chart clutter-free.
Advanced Visuals: Fully customizable colors, line styles, and label positioning (e.g., Align to Margin).
How to use:
Perfect for spotting "Equal Highs/Lows" (Liquidity) or confirming institutional support and resistance zones.
Key Features:
Multi-Timeframe Analysis: Automatically detects identical highs and lows on the current chart, as well as M5, M15, M30, H1, H4, and Daily.
NQ Auto-Detection: Specialized logic for Nasdaq (NQ) that automatically determines the ideal starting point for analysis based on volume, efficiency, and price density.
Live Statistics: Displays the number of touches and the bar distance from the first touchpoint directly on the price level.
Smart Cleaning: Levels are automatically removed once they are significantly breached by price, keeping your chart clutter-free.
Advanced Visuals: Fully customizable colors, line styles, and label positioning (e.g., Align to Margin).
How to use:
Perfect for spotting "Equal Highs/Lows" (Liquidity) or confirming institutional support and resistance zones.
Phát hành các Ghi chú
MTF Equals v1.1 – 01.02.2026Improvement: Seamless visualization of future lines across non-trading days.
Phát hành các Ghi chú
02/02/26Version 1.2 Fixed runtime error
Phát hành các Ghi chú
Technical Optimization (v1.2 → v1.3)Centralized Data Processing: Migrated from numerous individual arrays to a consolidated storage structure. This minimizes system load and prevents runtime errors when processing large datasets.
Logical Consistency: Implemented a unified calculation algorithm for all timeframes. This ensures identical statistics (touches/distances) across all chart levels.
Efficient Rendering: Optimized object management via Smart-Maps, providing smooth visual updates without graphical artifacts or lag during timeframe switches.
Structured Data Output: Reorganized tooltip information for faster analysis; price distance is now displayed as a single aggregated closing value.
Phát hành các Ghi chú
Dynamic History TrackingFirst Bar Timestamp: Automatically detects the date and time of the earliest available candle in the chart history.
Total Bar Count: Calculates the exact number of loaded bars to determine the data coverage provided by the current TradingView subscription level.
Phát hành các Ghi chú
// Fix 28.09.2026: HTF EQ source uses only the last confirmed HTF candle to keep live and recalculated levels consistent.// Fix 28.09.2026 Auto Rollover NQ cutoff: CME Equity-Index roll date from bot logic; pre-roll EQ sources are reset/excluded.
// Fix 28.09.2026 Futures-aware Auto Rollover: NQ/MNQ futures use the roll cutoff; all other charts use normal history in Auto mode.

Thông báo miễn trừ trách nhiệm
Thông tin và các ấn phẩm này không nhằm mục đích, và không cấu thành, lời khuyên hoặc khuyến nghị về tài chính, đầu tư, giao dịch hay các loại khác do TradingView cung cấp hoặc xác nhận. Đọc thêm tại Điều khoản Sử dụng.
Thông báo miễn trừ trách nhiệm
Thông tin và các ấn phẩm này không nhằm mục đích, và không cấu thành, lời khuyên hoặc khuyến nghị về tài chính, đầu tư, giao dịch hay các loại khác do TradingView cung cấp hoặc xác nhận. Đọc thêm tại Điều khoản Sử dụng.