OPEN-SOURCE SCRIPT
Momentum de Pips Institucional
Script Description
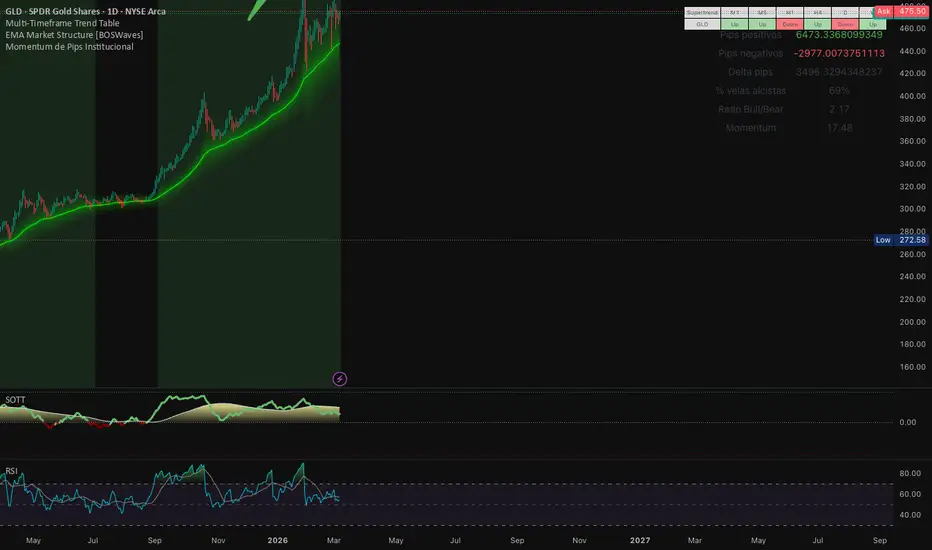
This indicator analyzes the price movement of the last N candles (default: 200) and calculates the accumulated positive and negative pip movement to measure market pressure and directional momentum.
For each candle, the script calculates the difference between the closing and opening prices and converts that movement into pips using the instrument's minimum tick size.
The indicator then aggregates these values over the selected lookback period to determine whether buyers or sellers have been dominating the market.
A table on the chart summarizes key market metrics.
Metrics Calculated
Positive Pips
Total accumulated pips from candles where:
Close > Open
This represents buying pressure.
Negative Pips
Total accumulated pips from candles where:
Close < Open
This represents selling pressure.
Delta Pips
Net market movement calculated as:
Delta = Positive Pips + Negative Pips
Interpretation:
Positive value → bullish dominance
Negative value → bearish dominance
Bullish Candle Percentage
Percentage of bullish candles within the analyzed period:
Bull % = (Bullish Candles / Total Candles) × 100
This helps identify whether the market structure favours buyers or sellers.
Bull/Bear Ratio
Measures the relative strength of bullish versus bearish movement:
Ratio = |Positive Pips / Negative Pips|
Interpretation:
Ratio Market Condition
≈1 Balanced market
1.5+ Trending market
2+ Strong directional pressure
Momentum
Directional momentum is calculated as:
Momentum = Delta / Number of Candles
This metric shows how quickly the market is moving in a particular direction.
Visual Signals
The script also highlights strong directional conditions:
Green background
Bullish candles > 60%
Delta pips positive
This indicates strong bullish dominance.
Red background
Bullish candles < 40%
Delta pips negative
This indicates strong bearish dominance.
Purpose of the Indicator
This indicator helps traders quickly identify:
Market pressure (buying vs selling)
Directional dominance
Momentum strength
Potential trending conditions
It can be used across Forex, indices, commodities, and cryptocurrencies to evaluate whether the recent price action favours continuation or reversal scenarios.
If you want, I can also write a much more professional TradingView publication description (the type used by top indicators) so that when you publish it, it looks very professional and gets more followers on TradingView.
This indicator analyzes the price movement of the last N candles (default: 200) and calculates the accumulated positive and negative pip movement to measure market pressure and directional momentum.
For each candle, the script calculates the difference between the closing and opening prices and converts that movement into pips using the instrument's minimum tick size.
The indicator then aggregates these values over the selected lookback period to determine whether buyers or sellers have been dominating the market.
A table on the chart summarizes key market metrics.
Metrics Calculated
Positive Pips
Total accumulated pips from candles where:
Close > Open
This represents buying pressure.
Negative Pips
Total accumulated pips from candles where:
Close < Open
This represents selling pressure.
Delta Pips
Net market movement calculated as:
Delta = Positive Pips + Negative Pips
Interpretation:
Positive value → bullish dominance
Negative value → bearish dominance
Bullish Candle Percentage
Percentage of bullish candles within the analyzed period:
Bull % = (Bullish Candles / Total Candles) × 100
This helps identify whether the market structure favours buyers or sellers.
Bull/Bear Ratio
Measures the relative strength of bullish versus bearish movement:
Ratio = |Positive Pips / Negative Pips|
Interpretation:
Ratio Market Condition
≈1 Balanced market
1.5+ Trending market
2+ Strong directional pressure
Momentum
Directional momentum is calculated as:
Momentum = Delta / Number of Candles
This metric shows how quickly the market is moving in a particular direction.
Visual Signals
The script also highlights strong directional conditions:
Green background
Bullish candles > 60%
Delta pips positive
This indicates strong bullish dominance.
Red background
Bullish candles < 40%
Delta pips negative
This indicates strong bearish dominance.
Purpose of the Indicator
This indicator helps traders quickly identify:
Market pressure (buying vs selling)
Directional dominance
Momentum strength
Potential trending conditions
It can be used across Forex, indices, commodities, and cryptocurrencies to evaluate whether the recent price action favours continuation or reversal scenarios.
If you want, I can also write a much more professional TradingView publication description (the type used by top indicators) so that when you publish it, it looks very professional and gets more followers on TradingView.
Mã nguồn mở
Theo đúng tinh thần TradingView, tác giả của tập lệnh này đã công bố nó dưới dạng mã nguồn mở, để các nhà giao dịch có thể xem xét và xác minh chức năng. Chúc mừng tác giả! Mặc dù bạn có thể sử dụng miễn phí, hãy nhớ rằng việc công bố lại mã phải tuân theo Nội quy.

Thông báo miễn trừ trách nhiệm
Thông tin và các ấn phẩm này không nhằm mục đích, và không cấu thành, lời khuyên hoặc khuyến nghị về tài chính, đầu tư, giao dịch hay các loại khác do TradingView cung cấp hoặc xác nhận. Đọc thêm tại Điều khoản Sử dụng.
Mã nguồn mở
Theo đúng tinh thần TradingView, tác giả của tập lệnh này đã công bố nó dưới dạng mã nguồn mở, để các nhà giao dịch có thể xem xét và xác minh chức năng. Chúc mừng tác giả! Mặc dù bạn có thể sử dụng miễn phí, hãy nhớ rằng việc công bố lại mã phải tuân theo Nội quy.
Thông báo miễn trừ trách nhiệm
Thông tin và các ấn phẩm này không nhằm mục đích, và không cấu thành, lời khuyên hoặc khuyến nghị về tài chính, đầu tư, giao dịch hay các loại khác do TradingView cung cấp hoặc xác nhận. Đọc thêm tại Điều khoản Sử dụng.