Quiet Range Tracker [MarkitTick]
More exclusive indicators from MarkitTick
Subscribe to MarkitTick for $43.75/month to get exclusive indicators by this author. You pay right on TradingView and can use them on your charts straight away.
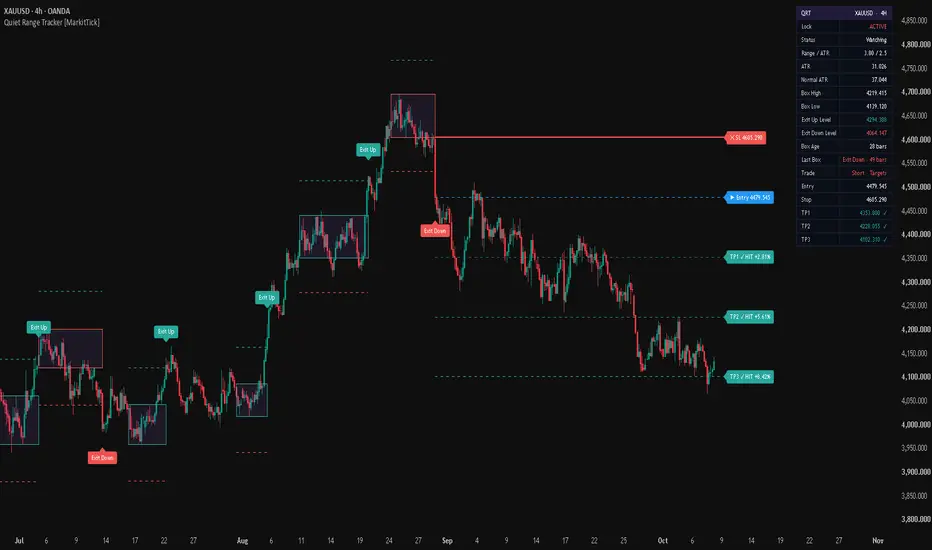
Explore MarkitTick💡 This script watches for stretches where price has gone quiet. It measures a box of recent highs and lows, compares the height of that box with the Average True Range, and starts watching a range only when the box is unusually tight. Once a range is found, its edges are frozen and two exit levels are drawn outside it, each one placed a set distance away from the box using the market's normal volatility. The range stays open, however many bars it takes, until a bar actually closes beyond one of the exit levels. That close is the real exit, and an optional trade plan with a stop and three targets can be built from it.
✨ Originality and Utility
Many range tools draw a box and call every touch of its edge a breakout. This script separates a quiet market from an ordinary one with a measured rule, then separates a real exit from a poke through the edge with a second measured rule.
● Mashup justification
Four ingredients are combined, and each one has a different job.
The components are not stacked at random. The first three form one chain, from location to size to scale. The filters are optional and can be switched off completely.
🔬 Methodology and Concepts
• Step 1: Measuring the box
On every bar the script takes the highest high and the lowest low of the last Box Length bars (default 12). The difference between them is the height of a candidate box.
• Step 2: Judging whether it is quiet
The Average True Range (default length 14) is calculated, optionally smoothed. The candidate box is quiet when its height is smaller than the Quiet Threshold multiplied by that ATR. The threshold offers two choices, 2.0 and 2.5, where 2.5 is the looser setting and finds more boxes.
• Step 3: Finding the normal ATR
The normal ATR is the median of the ATR over the Normal ATR Lookback (default 250 bars). A median is used instead of an average because a few violent bars barely move it. No box is allowed to start until the ATR has produced that many readings.
• Step 4: Freezing the box and placing exit levels
When a quiet box is found and no range is being watched, the script freezes the box high and box low. The upper exit level is the box high plus the Exit Distance multiplied by the normal ATR. The lower exit level is the box low minus the same amount. Both are rounded to the instrument's minimum tick. A lower level at or below zero is not a level and is not tracked.
• Step 5: Waiting for a real exit
While the range is watched, the script only asks one question: has a bar closed above the upper level or below the lower level? If yes, the range ends and the direction of the exit is recorded. If not, the box simply keeps waiting. Only one range is watched at a time.
• Step 6: Building the trade plan
When a real exit happens and the optional filters allow it, a trade plan opens at the close of that bar.
• Optional filters
• Lock Signal
When Lock Signal is on, the current trade plan stays on the chart and keeps being tracked, new signals are blocked, and boxes that start after the locked trade are hidden until the lock is turned off.
🎨 Visual Guide
• Dashboard
The table in the chosen corner shows the symbol and timeframe in its header, then these rows.
On charts that show synthetic prices, which are Heikin Ashi, Renko, Kagi, Point and Figure, Range and Line Break, the script shows a message in the middle of the chart and does not calculate. Switch to standard candles.
📖 How to Use
⚙️ Inputs and Settings
• Core Settings
• Filters
• Trade Tools, Visuals and Dashboard
• Alerts
Alert conditions are available for buy and sell signals, close long and close short, each target and the stop. In addition, the script can send a text message for each event, and the action words in that message for long, short, close and partial close are editable so they can match whatever tool receives them.
• Colors
Every colour used on the chart and in the dashboard can be changed in the Colors group.
🔍 Deconstruction of the Underlying Scientific and Academic Framework
• Volatility clustering
Mandelbrot noted in 1963 that large price changes tend to be followed by large changes and small by small. Engle formalised this in 1982 with autoregressive conditional heteroskedasticity models. A quiet box is a practical way to read the quiet half of that pattern directly from price, without fitting a statistical model.
• True range and the ATR
Wilder introduced the true range and the ATR in 1978. True range includes overnight gaps by comparing the high and low with the previous close, so the ATR measures the full distance price travelled. Dividing the box height by the ATR gives a unitless ratio that can be compared across markets and timeframes.
• Range-based measurement
Using the highest high and lowest low is a range-based view of price. Parkinson showed in 1980 that the high-low range carries more information about volatility than the close-to-close change alone, which is why a window of extremes is a reasonable measure of how wide the market has been trading.
• The median as a robust statistic
The mean of a series can be pulled far away by one extreme value. The median is resistant to that. Taking the median of the ATR over a long window gives a stable estimate of normal volatility even if the window contains a few news-driven spikes.
• Narrow ranges before wider ones
The idea that a narrow-range period tends to precede a wider one is long established among practitioners. Crabel described narrow-range days in 1990 as a base for studying what follows. This script does not claim the effect always appears. It measures when a narrow range exists and when it ends, so you can study the outcomes yourself.
• Risk expressed in units of risk
Setting targets at one, two and three times the stop distance expresses reward in multiples of the risk taken, a convention popularised in position-sizing literature. It keeps the reward-to-risk ratio of each target fixed and visible before the trade is considered.
• Limits of the framework
The ADX is also from Wilder's 1978 work and measures strength of direction, not direction itself. A quiet range can end with a close beyond a level and then return inside. A fixed multiple of the stop distance is a planning aid, not a forecast. A stop that is judged on a close can be passed by a wide margin if the market gaps.
⚠️ Disclaimer
All provided scripts and indicators are strictly for educational exploration and must not be interpreted as financial advice or a recommendation to execute trades. We expressly disclaim all liability for any financial losses or damages that may result, directly or indirectly, from the reliance on or application of these tools. Market participation carries inherent risk where past performance never guarantees future returns, leaving all investment decisions and due diligence solely at your own discretion.
✨ Originality and Utility
Many range tools draw a box and call every touch of its edge a breakout. This script separates a quiet market from an ordinary one with a measured rule, then separates a real exit from a poke through the edge with a second measured rule.
- Quietness is not judged by eye. The box height is divided by the Average True Range, and the box counts as quiet only when that ratio is below the Quiet Threshold.
- The exit levels are not a fixed number of ticks or percent. They are the frozen box edge plus or minus a multiple of the normal ATR, so the same setting adapts to a slow stock and a fast crypto pair.
- A touch of an exit level without a close beyond it is ignored. Only a close beyond the level ends the range.
- A range is never abandoned because it is old. It stays open until a real exit, so a long quiet period is tracked as one event instead of being cut into pieces.
- Nothing starts until the ATR has produced enough readings to calculate its normal value. During this warm-up the dashboard says so instead of drawing levels built on too little history.
● Mashup justification
Four ingredients are combined, and each one has a different job.
- Highest high and lowest low over a window define the box, which is the same construction as a Donchian channel. It answers where the range is.
- The Average True Range answers how big that range is relative to current volatility, which decides whether it is quiet.
- The median of the ATR over a long lookback answers what normal volatility looks like, which sets the distance of the exit levels.
- The optional ADX and Higher Timeframe filters answer whether the market already shows directional strength or agreement from a slower timeframe before a trade plan is allowed.
The components are not stacked at random. The first three form one chain, from location to size to scale. The filters are optional and can be switched off completely.
🔬 Methodology and Concepts
• Step 1: Measuring the box
On every bar the script takes the highest high and the lowest low of the last Box Length bars (default 12). The difference between them is the height of a candidate box.
• Step 2: Judging whether it is quiet
The Average True Range (default length 14) is calculated, optionally smoothed. The candidate box is quiet when its height is smaller than the Quiet Threshold multiplied by that ATR. The threshold offers two choices, 2.0 and 2.5, where 2.5 is the looser setting and finds more boxes.
• Step 3: Finding the normal ATR
The normal ATR is the median of the ATR over the Normal ATR Lookback (default 250 bars). A median is used instead of an average because a few violent bars barely move it. No box is allowed to start until the ATR has produced that many readings.
• Step 4: Freezing the box and placing exit levels
When a quiet box is found and no range is being watched, the script freezes the box high and box low. The upper exit level is the box high plus the Exit Distance multiplied by the normal ATR. The lower exit level is the box low minus the same amount. Both are rounded to the instrument's minimum tick. A lower level at or below zero is not a level and is not tracked.
• Step 5: Waiting for a real exit
While the range is watched, the script only asks one question: has a bar closed above the upper level or below the lower level? If yes, the range ends and the direction of the exit is recorded. If not, the box simply keeps waiting. Only one range is watched at a time.
• Step 6: Building the trade plan
When a real exit happens and the optional filters allow it, a trade plan opens at the close of that bar.
- Entry is the close of the exit bar.
- Stop is the frozen box edge on the side of the exit: the box high for an upward exit, the box low for a downward exit.
- Risk is the distance from entry to stop.
- TP1, TP2 and TP3 sit at one, two and three times that risk away from entry, in the direction of the trade.
- A target counts when price touches it. The stop counts only when a bar closes beyond it.
- The trade ends at its last target, at a close beyond the stop, when a trade in the opposite direction opens, or when a new signal in the same direction replaces it.
- If the risk is not larger than one minimum tick, or a target would fall at or below zero, that level is not drawn or tracked.
• Optional filters
- Higher Timeframe Confirmation runs the same box, ATR and exit calculation on a slower timeframe with the same settings. A long additionally needs the last real exit on that timeframe to have been up, and a short needs it to have been down. When the chosen timeframe equals the chart timeframe, the chart's own last exit is used. A timeframe lower than the chart is skipped and the dashboard says so.
- Trend Strength Filter reads the ADX on the signal bar. A trade is allowed only when the ADX is at or above the Trend Strength Threshold (default 20).
- Adaptive Smoothing smooths the ATR with SMA, EMA, WMA, RMA or HMA before anything is calculated from it. With None the raw ATR is used.
• Lock Signal
When Lock Signal is on, the current trade plan stays on the chart and keeps being tracked, new signals are blocked, and boxes that start after the locked trade are hidden until the lock is turned off.
🎨 Visual Guide
- Yellow box with a pale yellow fill: a range that is still being watched. The box stretches to the right edge of the chart while it waits.
- Box after its real exit: the fill turns to a faded purple, and the border takes the colour of the exit direction.
- Teal dashed line above the box: the upper exit level. A teal border on a finished box means the range ended with an exit up.
- Red dashed line below the box: the lower exit level. A red border on a finished box means the range ended with an exit down.
- Teal label reading Exit Up, drawn above the bar: marks the bar where the range ended upward.
- Red label reading Exit Down, drawn below the bar: marks the bar where the range ended downward.
- Red solid line with a label starting with SL: the stop of the trade plan.
- Blue dashed line with a label starting with Entry: the entry price.
- Teal dashed lines with labels TP1, TP2 and TP3: the three targets. The TP1 line is the faintest and the TP3 line is the strongest.
- When a target is touched, its label changes to a HIT text with the percentage distance from entry. A stop that is hit changes its label the same way.
- The trade lines extend a short distance to the right of the last bar so the labels stay readable.
• Dashboard
The table in the chosen corner shows the symbol and timeframe in its header, then these rows.
- Lock: ACTIVE or OFF.
- Status: Warm-up while the normal ATR is still being built, Watching while a range is open, Idle otherwise.
- Range / ATR: the height of the latest box candidate divided by the ATR, next to the Quiet Threshold.
- ATR and Normal ATR: the current and the normal volatility readings.
- Box High, Box Low, Exit Up Level, Exit Down Level and Box Age: shown only while a range is watched.
- Last Box: how the previous range ended and how many bars it lasted.
- Trade, Entry, Stop, TP1, TP2, TP3: the direction and state of the latest trade and its levels. A check mark appears next to a level that has been hit.
- HTF Direction, Trend Strength and Smoothing: shown only while the matching setting is on.
- A highlighted warning row appears when the Higher Timeframe was skipped.
On charts that show synthetic prices, which are Heikin Ashi, Renko, Kagi, Point and Figure, Range and Line Break, the script shows a message in the middle of the chart and does not calculate. Switch to standard candles.
📖 How to Use
- Add the script to a standard candle chart and wait until the dashboard no longer says Warm-up. If the chart has fewer bars than the Normal ATR Lookback, lower that setting or load more history.
- When the dashboard says Watching, a quiet box exists. The yellow box and the two dashed exit levels show where the range is and where it must be left.
- Read Range / ATR. A ratio far below the threshold means a very tight box, and a ratio close to the threshold means a box that only just qualified.
- Treat a close beyond an exit level as a change of state from quiet to active, not as a promise of direction continuing. The Exit Up and Exit Down labels mark that bar.
- If the trade plan is useful to you, use the entry, stop and three targets as a reference for planning risk. Each target is a fixed multiple of the stop distance, so you can judge in advance whether the reward is worth the risk.
- Turn on the Trend Strength Filter when you want exits that happen while the market already shows directional strength, and the Higher Timeframe Confirmation when you want exits that agree with a slower timeframe. Both reduce the number of trade plans.
- Use the Lock Signal setting when you want to keep studying one trade on the chart while newer boxes are ignored.
⚙️ Inputs and Settings
• Core Settings
- Box Length: how many bars form the box. A longer box covers more history and is usually taller, so fewer boxes qualify as quiet.
- ATR Length: the period of the ATR used to judge quietness.
- Quiet Threshold: 2.0 is stricter and finds fewer, tighter boxes. 2.5 is looser and finds more.
- Exit Distance: the multiple of the normal ATR added outside the box edge. A larger value puts the exit levels further away and makes a real exit rarer.
- Normal ATR Lookback: the number of bars used for the median ATR. It is also the warm-up length.
• Filters
- Higher Timeframe Confirmation and Higher Timeframe: switch the confirmation on and choose its timeframe.
- Trend Strength Filter, Trend Strength Length and Trend Strength Threshold: switch on the ADX condition and set its length and minimum value.
- Adaptive Smoothing and Smoothing Length: choose how the ATR is smoothed and over how many bars.
• Trade Tools, Visuals and Dashboard
- Lock Signal freezes the current trade plan.
- Show Box, Show Exit Levels and Show Markers hide the matching drawings without stopping any calculation.
- Max Boxes Shown keeps only the latest boxes on the chart to avoid clutter. It removes drawings only.
- Show Dashboard and Position control the table.
• Alerts
Alert conditions are available for buy and sell signals, close long and close short, each target and the stop. In addition, the script can send a text message for each event, and the action words in that message for long, short, close and partial close are editable so they can match whatever tool receives them.
• Colors
Every colour used on the chart and in the dashboard can be changed in the Colors group.
🔍 Deconstruction of the Underlying Scientific and Academic Framework
• Volatility clustering
Mandelbrot noted in 1963 that large price changes tend to be followed by large changes and small by small. Engle formalised this in 1982 with autoregressive conditional heteroskedasticity models. A quiet box is a practical way to read the quiet half of that pattern directly from price, without fitting a statistical model.
• True range and the ATR
Wilder introduced the true range and the ATR in 1978. True range includes overnight gaps by comparing the high and low with the previous close, so the ATR measures the full distance price travelled. Dividing the box height by the ATR gives a unitless ratio that can be compared across markets and timeframes.
• Range-based measurement
Using the highest high and lowest low is a range-based view of price. Parkinson showed in 1980 that the high-low range carries more information about volatility than the close-to-close change alone, which is why a window of extremes is a reasonable measure of how wide the market has been trading.
• The median as a robust statistic
The mean of a series can be pulled far away by one extreme value. The median is resistant to that. Taking the median of the ATR over a long window gives a stable estimate of normal volatility even if the window contains a few news-driven spikes.
• Narrow ranges before wider ones
The idea that a narrow-range period tends to precede a wider one is long established among practitioners. Crabel described narrow-range days in 1990 as a base for studying what follows. This script does not claim the effect always appears. It measures when a narrow range exists and when it ends, so you can study the outcomes yourself.
• Risk expressed in units of risk
Setting targets at one, two and three times the stop distance expresses reward in multiples of the risk taken, a convention popularised in position-sizing literature. It keeps the reward-to-risk ratio of each target fixed and visible before the trade is considered.
• Limits of the framework
The ADX is also from Wilder's 1978 work and measures strength of direction, not direction itself. A quiet range can end with a close beyond a level and then return inside. A fixed multiple of the stop distance is a planning aid, not a forecast. A stop that is judged on a close can be passed by a wide margin if the market gaps.
⚠️ Disclaimer
All provided scripts and indicators are strictly for educational exploration and must not be interpreted as financial advice or a recommendation to execute trades. We expressly disclaim all liability for any financial losses or damages that may result, directly or indirectly, from the reliance on or application of these tools. Market participation carries inherent risk where past performance never guarantees future returns, leaving all investment decisions and due diligence solely at your own discretion.

💡 Proprietary indicators. Original research. Built by analysts who trade.
📢 Free Telegram: t.me/MarkitTick_Updates
👑 Premium: TradingView Marketplace
📘 Guides: markittick.com
📢 Free Telegram: t.me/MarkitTick_Updates
👑 Premium: TradingView Marketplace
📘 Guides: markittick.com
Thông báo miễn trừ trách nhiệm
Thông tin và các ấn phẩm này không nhằm mục đích, và không cấu thành, lời khuyên hoặc khuyến nghị về tài chính, đầu tư, giao dịch hay các loại khác do TradingView cung cấp hoặc xác nhận. Đọc thêm tại Điều khoản Sử dụng.
💡 Proprietary indicators. Original research. Built by analysts who trade.
📢 Free Telegram: t.me/MarkitTick_Updates
👑 Premium: TradingView Marketplace
📘 Guides: markittick.com
📢 Free Telegram: t.me/MarkitTick_Updates
👑 Premium: TradingView Marketplace
📘 Guides: markittick.com
Thông báo miễn trừ trách nhiệm
Thông tin và các ấn phẩm này không nhằm mục đích, và không cấu thành, lời khuyên hoặc khuyến nghị về tài chính, đầu tư, giao dịch hay các loại khác do TradingView cung cấp hoặc xác nhận. Đọc thêm tại Điều khoản Sử dụng.