OPEN-SOURCE SCRIPT
Correlation Regime [ThetaLoop]
On a normal Tuesday, your five positions behave like five independent bets. Apple does its thing. Energy moves on oil. Banks react to yields. This is diversification doing its job.
Then a tariff headline drops. Or the Fed surprises. Suddenly Apple, energy, and banks all fall in lockstep. Your five independent bets become one giant bet. Your risk just quintupled without you adding a single position.
This is the correlation regime shift — the most dangerous invisible risk in any multi-position portfolio. This indicator makes it visible.
What it measures
Rolling correlation between your stock and a broad market benchmark (SPY by default, switchable to QQQ, IWM, or DIA). Correlation of 1.0 means perfect lockstep. Correlation of 0 means independent movement. Negative correlation means they move opposite.
The four regimes
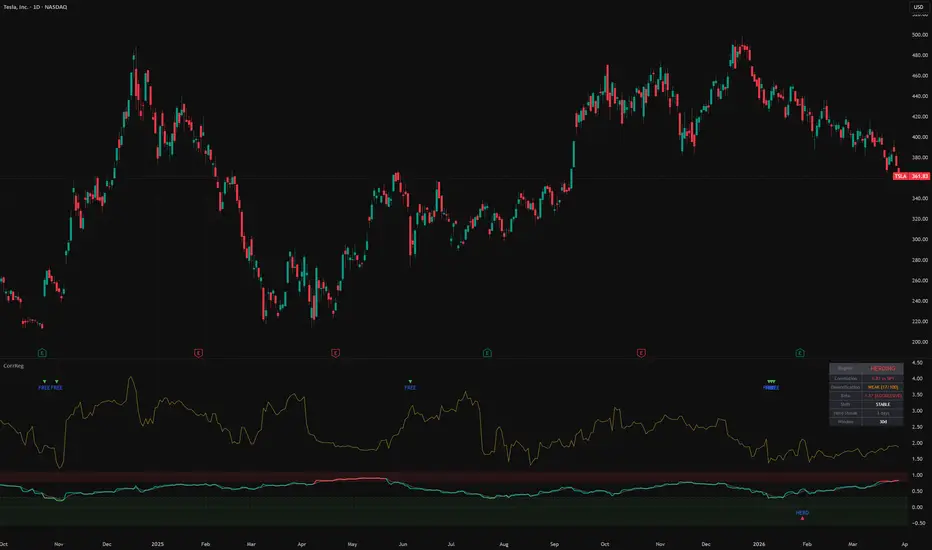
HERDING (red, correlation above 0.80) — The stock is marching in lockstep with the market. Your position does not provide diversification. If you have multiple positions in herding mode simultaneously, you effectively have one concentrated directional bet. This is the regime where sector limits and position count limits fail to protect you.
NORMAL (teal, correlation 0.30 to 0.80) — Typical market conditions. The stock is influenced by broad market moves but retains meaningful independent behavior. Standard diversification assumptions hold.
INDEPENDENT (green, correlation 0 to 0.30) — Genuinely uncorrelated movement. This is where diversification actually works as advertised. Multiple positions in this regime genuinely reduce portfolio volatility.
DIVERGENT (purple, negative correlation) — The stock moves opposite to the market. Rare for equities outside of specific hedging instruments. If you see this on a stock you are selling puts on, investigate why — it might signal something structural.
The diversification score
A single number from 0 to 100 that translates correlation into a practical assessment. 100 means fully independent (maximum diversification benefit). 0 means perfect herding (zero diversification benefit). Think of it as: "What percentage of this position's risk is actually independent from my other positions?"
Rolling beta
Shown as a yellow line (toggleable). Beta tells you how much this stock amplifies market moves. Beta 1.5 means a 1% SPY drop causes roughly a 1.5% drop in this stock. For put sellers, high beta + high correlation is the worst combination — you get amplified market moves with no diversification offset.
Regime shift detection
HERD markers (red triangles) appear when correlation surges rapidly — the moment diversification is breaking down in real time. FREE markers (green triangles) appear when correlation drops sharply — the stock is decoupling from the market.
The Herd Streak counter tracks how many consecutive days correlation has been above the herding threshold. A streak above 10 days is a structural shift, not a temporary spike.
How to use this for options selling
Before opening a new position, check whether the stock is in herding mode. If it is, and your other positions are also herding, adding this position does not diversify your book — it concentrates it further.
When the correlation regime shifts from normal to herding, your effective portfolio risk increases even though your positions have not changed. This is the time to reduce overall exposure, not because any individual position is bad, but because your portfolio is less protected than you think.
Use the beta reading alongside correlation. Low correlation + low beta = defensive position that provides genuine diversification. High correlation + high beta = the position that will hurt most in a selloff.
Settings
Lookback Period (default 30) — Rolling window for correlation. Shorter reacts faster but is noisier.
Benchmark — SPY (default), QQQ, IWM, or DIA.
High/Low Correlation thresholds — Adjustable regime boundaries.
Shift Detection — Window and threshold for identifying rapid correlation changes.
Alerts
Correlation Surge — Diversification is breaking down in real time.
Herding Regime — Stock moving in lockstep with market.
Independent Regime — Genuine diversification benefit detected.
Prolonged Herding — Correlation elevated for 10+ consecutive days.
Then a tariff headline drops. Or the Fed surprises. Suddenly Apple, energy, and banks all fall in lockstep. Your five independent bets become one giant bet. Your risk just quintupled without you adding a single position.
This is the correlation regime shift — the most dangerous invisible risk in any multi-position portfolio. This indicator makes it visible.
What it measures
Rolling correlation between your stock and a broad market benchmark (SPY by default, switchable to QQQ, IWM, or DIA). Correlation of 1.0 means perfect lockstep. Correlation of 0 means independent movement. Negative correlation means they move opposite.
The four regimes
HERDING (red, correlation above 0.80) — The stock is marching in lockstep with the market. Your position does not provide diversification. If you have multiple positions in herding mode simultaneously, you effectively have one concentrated directional bet. This is the regime where sector limits and position count limits fail to protect you.
NORMAL (teal, correlation 0.30 to 0.80) — Typical market conditions. The stock is influenced by broad market moves but retains meaningful independent behavior. Standard diversification assumptions hold.
INDEPENDENT (green, correlation 0 to 0.30) — Genuinely uncorrelated movement. This is where diversification actually works as advertised. Multiple positions in this regime genuinely reduce portfolio volatility.
DIVERGENT (purple, negative correlation) — The stock moves opposite to the market. Rare for equities outside of specific hedging instruments. If you see this on a stock you are selling puts on, investigate why — it might signal something structural.
The diversification score
A single number from 0 to 100 that translates correlation into a practical assessment. 100 means fully independent (maximum diversification benefit). 0 means perfect herding (zero diversification benefit). Think of it as: "What percentage of this position's risk is actually independent from my other positions?"
Rolling beta
Shown as a yellow line (toggleable). Beta tells you how much this stock amplifies market moves. Beta 1.5 means a 1% SPY drop causes roughly a 1.5% drop in this stock. For put sellers, high beta + high correlation is the worst combination — you get amplified market moves with no diversification offset.
Regime shift detection
HERD markers (red triangles) appear when correlation surges rapidly — the moment diversification is breaking down in real time. FREE markers (green triangles) appear when correlation drops sharply — the stock is decoupling from the market.
The Herd Streak counter tracks how many consecutive days correlation has been above the herding threshold. A streak above 10 days is a structural shift, not a temporary spike.
How to use this for options selling
Before opening a new position, check whether the stock is in herding mode. If it is, and your other positions are also herding, adding this position does not diversify your book — it concentrates it further.
When the correlation regime shifts from normal to herding, your effective portfolio risk increases even though your positions have not changed. This is the time to reduce overall exposure, not because any individual position is bad, but because your portfolio is less protected than you think.
Use the beta reading alongside correlation. Low correlation + low beta = defensive position that provides genuine diversification. High correlation + high beta = the position that will hurt most in a selloff.
Settings
Lookback Period (default 30) — Rolling window for correlation. Shorter reacts faster but is noisier.
Benchmark — SPY (default), QQQ, IWM, or DIA.
High/Low Correlation thresholds — Adjustable regime boundaries.
Shift Detection — Window and threshold for identifying rapid correlation changes.
Alerts
Correlation Surge — Diversification is breaking down in real time.
Herding Regime — Stock moving in lockstep with market.
Independent Regime — Genuine diversification benefit detected.
Prolonged Herding — Correlation elevated for 10+ consecutive days.
Mã nguồn mở
Theo đúng tinh thần TradingView, tác giả của tập lệnh này đã công bố nó dưới dạng mã nguồn mở, để các nhà giao dịch có thể xem xét và xác minh chức năng. Chúc mừng tác giả! Mặc dù bạn có thể sử dụng miễn phí, hãy nhớ rằng việc công bố lại mã phải tuân theo Nội quy.

ThetaLoop | Algorithmic Options Research
🔍 Free CSP Score for any ticker — X-Ray Scanner:
thetaloop.app/xray
(Not financial advice)
🔍 Free CSP Score for any ticker — X-Ray Scanner:
thetaloop.app/xray
(Not financial advice)
Thông báo miễn trừ trách nhiệm
Thông tin và các ấn phẩm này không nhằm mục đích, và không cấu thành, lời khuyên hoặc khuyến nghị về tài chính, đầu tư, giao dịch hay các loại khác do TradingView cung cấp hoặc xác nhận. Đọc thêm tại Điều khoản Sử dụng.
Mã nguồn mở
Theo đúng tinh thần TradingView, tác giả của tập lệnh này đã công bố nó dưới dạng mã nguồn mở, để các nhà giao dịch có thể xem xét và xác minh chức năng. Chúc mừng tác giả! Mặc dù bạn có thể sử dụng miễn phí, hãy nhớ rằng việc công bố lại mã phải tuân theo Nội quy.
ThetaLoop | Algorithmic Options Research
🔍 Free CSP Score for any ticker — X-Ray Scanner:
thetaloop.app/xray
(Not financial advice)
🔍 Free CSP Score for any ticker — X-Ray Scanner:
thetaloop.app/xray
(Not financial advice)
Thông báo miễn trừ trách nhiệm
Thông tin và các ấn phẩm này không nhằm mục đích, và không cấu thành, lời khuyên hoặc khuyến nghị về tài chính, đầu tư, giao dịch hay các loại khác do TradingView cung cấp hoặc xác nhận. Đọc thêm tại Điều khoản Sử dụng.