RSI EMA Dot (Long Below / Short Above)
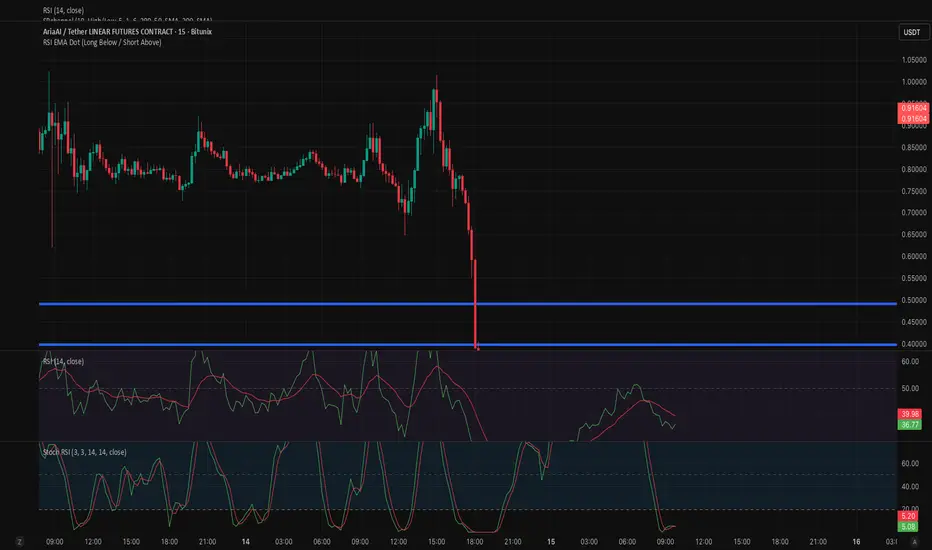
RSI EMA Cross Dot Indicator
This indicator identifies potential reversal points by combining RSI extremes with momentum shifts.
A signal is generated when the RSI (14) crosses its EMA (14) after being in an extreme zone:
Long signal (green dot below the candle):
RSI was below 20 (oversold) and then crosses above its EMA.
Short signal (red dot above the candle):
RSI was above 80 (overbought) and then crosses below its EMA.
Dots are plotted directly on the chart:
Long signals appear below the candle
Short signals appear above the candle
This helps highlight potential market reversals after extreme conditions, making it useful for identifying high-probability reaction zones.
This indicator identifies potential reversal points by combining RSI extremes with momentum shifts.
A signal is generated when the RSI (14) crosses its EMA (14) after being in an extreme zone:
Long signal (green dot below the candle):
RSI was below 20 (oversold) and then crosses above its EMA.
Short signal (red dot above the candle):
RSI was above 80 (overbought) and then crosses below its EMA.
Dots are plotted directly on the chart:
Long signals appear below the candle
Short signals appear above the candle
This helps highlight potential market reversals after extreme conditions, making it useful for identifying high-probability reaction zones.

Thông báo miễn trừ trách nhiệm
Thông tin và các ấn phẩm này không nhằm mục đích, và không cấu thành, lời khuyên hoặc khuyến nghị về tài chính, đầu tư, giao dịch hay các loại khác do TradingView cung cấp hoặc xác nhận. Đọc thêm tại Điều khoản Sử dụng.
Thông báo miễn trừ trách nhiệm
Thông tin và các ấn phẩm này không nhằm mục đích, và không cấu thành, lời khuyên hoặc khuyến nghị về tài chính, đầu tư, giao dịch hay các loại khác do TradingView cung cấp hoặc xác nhận. Đọc thêm tại Điều khoản Sử dụng.