OPEN-SOURCE SCRIPT
PMH / PML Each Day
# PMH / PML Each Day Levels
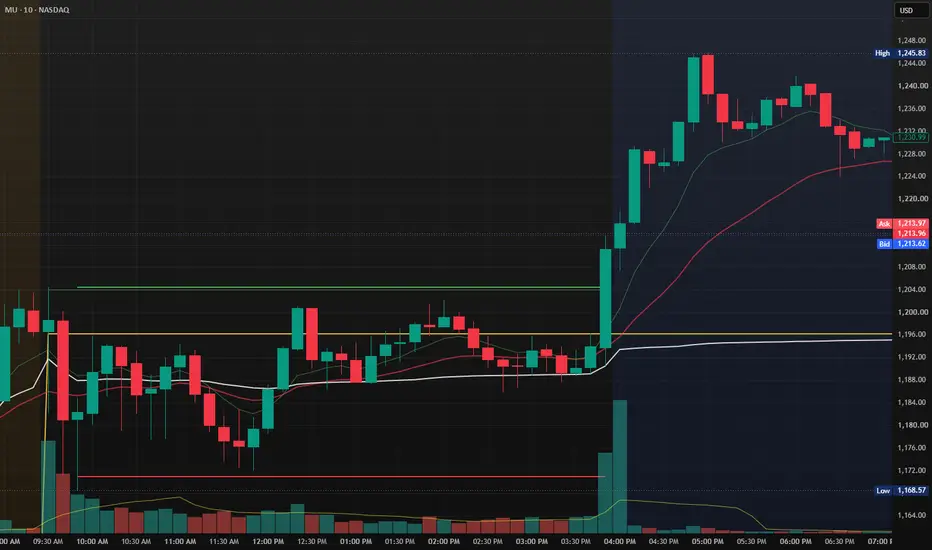
This indicator automatically plots the **Previous Market High (PMH)** and **Previous Market Low (PML)** for every trading day using **Regular Trading Hours (RTH)** only.
### Features
* Plots the Previous Market High (PMH) and Previous Market Low (PML) for every trading session.
* Uses only **9:30 AM – 4:00 PM (Regular Market Hours)**.
* Draws historical PMH/PML levels for every day, making it ideal for backtesting.
* Each day's levels are displayed independently and do not overwrite previous sessions.
* Clean horizontal lines help identify important support and resistance levels.
* Works across all intraday timeframes.
* Perfect for price action, ORB, liquidity sweeps, and breakout/reversal strategies.
### Ideal For
* Intraday traders
* Opening Range Breakout (ORB) traders
* Support & Resistance analysis
* Historical chart review and backtesting
* Liquidity and market structure traders
This indicator provides a simple and reliable way to visualize the previous day's key market levels, allowing traders to quickly identify areas where price may react during the current trading session.
This indicator automatically plots the **Previous Market High (PMH)** and **Previous Market Low (PML)** for every trading day using **Regular Trading Hours (RTH)** only.
### Features
* Plots the Previous Market High (PMH) and Previous Market Low (PML) for every trading session.
* Uses only **9:30 AM – 4:00 PM (Regular Market Hours)**.
* Draws historical PMH/PML levels for every day, making it ideal for backtesting.
* Each day's levels are displayed independently and do not overwrite previous sessions.
* Clean horizontal lines help identify important support and resistance levels.
* Works across all intraday timeframes.
* Perfect for price action, ORB, liquidity sweeps, and breakout/reversal strategies.
### Ideal For
* Intraday traders
* Opening Range Breakout (ORB) traders
* Support & Resistance analysis
* Historical chart review and backtesting
* Liquidity and market structure traders
This indicator provides a simple and reliable way to visualize the previous day's key market levels, allowing traders to quickly identify areas where price may react during the current trading session.
Mã nguồn mở
Theo đúng tinh thần TradingView, tác giả của tập lệnh này đã công bố nó dưới dạng mã nguồn mở, để các nhà giao dịch có thể xem xét và xác minh chức năng. Chúc mừng tác giả! Mặc dù bạn có thể sử dụng miễn phí, hãy nhớ rằng việc công bố lại mã phải tuân theo Nội quy.

Thông báo miễn trừ trách nhiệm
Thông tin và các ấn phẩm này không nhằm mục đích, và không cấu thành, lời khuyên hoặc khuyến nghị về tài chính, đầu tư, giao dịch hay các loại khác do TradingView cung cấp hoặc xác nhận. Đọc thêm tại Điều khoản Sử dụng.
Mã nguồn mở
Theo đúng tinh thần TradingView, tác giả của tập lệnh này đã công bố nó dưới dạng mã nguồn mở, để các nhà giao dịch có thể xem xét và xác minh chức năng. Chúc mừng tác giả! Mặc dù bạn có thể sử dụng miễn phí, hãy nhớ rằng việc công bố lại mã phải tuân theo Nội quy.
Thông báo miễn trừ trách nhiệm
Thông tin và các ấn phẩm này không nhằm mục đích, và không cấu thành, lời khuyên hoặc khuyến nghị về tài chính, đầu tư, giao dịch hay các loại khác do TradingView cung cấp hoặc xác nhận. Đọc thêm tại Điều khoản Sử dụng.