OPEN-SOURCE SCRIPT
Cập nhật Daily RVOL (Raw) SMA/EMA + Surge Marker - TP
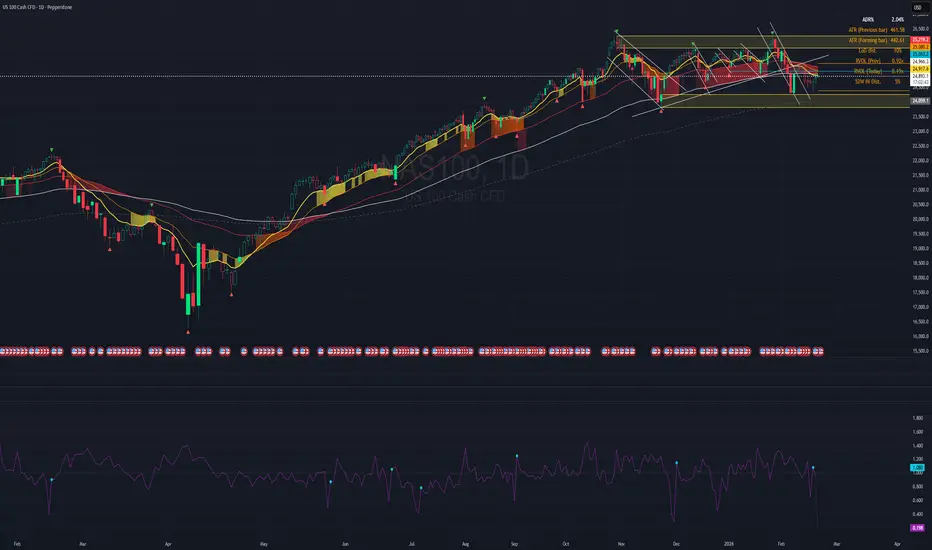
## Daily RVOL (Raw) SMA/EMA + Surge Marker (TP)
This indicator helps you spot **unusual institutional-style participation** by measuring **Daily Relative Volume (RVOL)** and highlighting **sudden RVOL “surges”** compared to the prior day.
### What it shows
**RVOL (raw)** is a ratio:
**RVOL = Today’s Daily Volume ÷ Average Daily Volume (lookback)**
* **1.00x** = normal volume
* **1.50x** = ~50% above normal
* **2.00x** = ~2x normal
The “Average Daily Volume” baseline can be calculated using either:
* **SMA** (simple average), or
* **EMA** (faster-reacting average)
The baseline uses **completed daily bars only**, so it won’t be distorted by a partially completed day.
### Surge Marker (Circle)
The circle prints when **today’s RVOL jumps significantly vs yesterday’s RVOL**:
**RVOL Surge % = (RVOL Today ÷ RVOL Prev − 1) × 100**
So if your surge threshold is **80%**, the circle triggers when:
**RVOL Today ≥ 1.80 × RVOL Prev**
This is meant to detect **volume acceleration**—not just “high volume,” but a **step-change** in participation.
### How to use it (in plain English)
Think of RVOL as a **crowd-size meter**, and the surge circle as a **“big money showed up today”** alert.
It does **not** directly label buy vs sell—it highlights **participation**. Direction comes from price action and context.
### Bullish vs Bearish clues (price + volume together)
Use the circle as a clue, then read the candle and key levels:
**Potential bullish signs**
* Breakout/reclaim of resistance + surge circle (strong confirmation)
* Strong up day (wide range, closes near highs) + surge circle
* **High volume down-close that *does NOT* break lower lows** (holds support)
→ Often means selling pressure was absorbed and price held the line. This can be a **bullish “support/absorption” tell**, especially if the next day confirms with strength.
**Potential bearish signs**
* Breakdown below support + surge circle (distribution confirmation)
* Rejection at resistance on surge circle (supply showing up)
* **High volume up-close that *fails to make higher highs* / can’t push through resistance**
→ Often suggests buying effort was met by strong supply (selling into strength). This can be a **bearish “stall/failure” tell**, especially if the next day confirms with weakness.
### Suggested settings
* **RVOL Length:** 20 is a solid default
* **SMA vs EMA:**
* SMA = smoother baseline
* EMA = reacts faster to recent volume changes
* **Surge Threshold:**
* **80–150%** = rare “shock” participation (fewer, stronger signals)
* **40–80%** = balanced signals
* **10–40%** = more signals, more noise
### Best practice
Use RVOL + surge circles as **confirmation**, not a standalone entry/exit:
* Combine with trend, support/resistance, and candle structure.
* The surge circle says **“participation surged”**—price action tells you **whether it’s accumulation (support) or distribution (supply).**
*(Educational use only. Not financial advice.)*
This indicator helps you spot **unusual institutional-style participation** by measuring **Daily Relative Volume (RVOL)** and highlighting **sudden RVOL “surges”** compared to the prior day.
### What it shows
**RVOL (raw)** is a ratio:
**RVOL = Today’s Daily Volume ÷ Average Daily Volume (lookback)**
* **1.00x** = normal volume
* **1.50x** = ~50% above normal
* **2.00x** = ~2x normal
The “Average Daily Volume” baseline can be calculated using either:
* **SMA** (simple average), or
* **EMA** (faster-reacting average)
The baseline uses **completed daily bars only**, so it won’t be distorted by a partially completed day.
### Surge Marker (Circle)
The circle prints when **today’s RVOL jumps significantly vs yesterday’s RVOL**:
**RVOL Surge % = (RVOL Today ÷ RVOL Prev − 1) × 100**
So if your surge threshold is **80%**, the circle triggers when:
**RVOL Today ≥ 1.80 × RVOL Prev**
This is meant to detect **volume acceleration**—not just “high volume,” but a **step-change** in participation.
### How to use it (in plain English)
Think of RVOL as a **crowd-size meter**, and the surge circle as a **“big money showed up today”** alert.
It does **not** directly label buy vs sell—it highlights **participation**. Direction comes from price action and context.
### Bullish vs Bearish clues (price + volume together)
Use the circle as a clue, then read the candle and key levels:
**Potential bullish signs**
* Breakout/reclaim of resistance + surge circle (strong confirmation)
* Strong up day (wide range, closes near highs) + surge circle
* **High volume down-close that *does NOT* break lower lows** (holds support)
→ Often means selling pressure was absorbed and price held the line. This can be a **bullish “support/absorption” tell**, especially if the next day confirms with strength.
**Potential bearish signs**
* Breakdown below support + surge circle (distribution confirmation)
* Rejection at resistance on surge circle (supply showing up)
* **High volume up-close that *fails to make higher highs* / can’t push through resistance**
→ Often suggests buying effort was met by strong supply (selling into strength). This can be a **bearish “stall/failure” tell**, especially if the next day confirms with weakness.
### Suggested settings
* **RVOL Length:** 20 is a solid default
* **SMA vs EMA:**
* SMA = smoother baseline
* EMA = reacts faster to recent volume changes
* **Surge Threshold:**
* **80–150%** = rare “shock” participation (fewer, stronger signals)
* **40–80%** = balanced signals
* **10–40%** = more signals, more noise
### Best practice
Use RVOL + surge circles as **confirmation**, not a standalone entry/exit:
* Combine with trend, support/resistance, and candle structure.
* The surge circle says **“participation surged”**—price action tells you **whether it’s accumulation (support) or distribution (supply).**
*(Educational use only. Not financial advice.)*
Phát hành các Ghi chú
* The RVOL now **automatically matches your chart timeframe**.* On **Daily** charts, it shows **Daily RVOL**.
* On **Weekly** charts, it shows **Weekly RVOL**.
* On **Monthly** charts, it shows **Monthly RVOL**.
* If you’re on an **intraday chart** (like 5m/1h), it **still shows Daily RVOL** by default.
* It still updates **live during the current bar** (day/week/month): as volume keeps coming in, the RVOL value updates in real time.
* The “average” it compares against is based on **only fully finished past bars**, so the baseline stays clean and doesn’t get distorted by today/this week’s partial volume.
Phát hành các Ghi chú
Screenshot updatePhát hành các Ghi chú
Added a “Forming Bar Opacity” setting that automatically fades the **latest (still-building) bar** on the RVOL line and surge circles, so you can visually tell the current live value is not finalized yet—while all completed bars stay fully solid.----
Additional findings: Sudden drop in RVOL signifies a reversal may it be upward or downward(sudden volume drying up preparing for a next decisive move)
Mã nguồn mở
Theo đúng tinh thần TradingView, tác giả của tập lệnh này đã công bố nó dưới dạng mã nguồn mở, để các nhà giao dịch có thể xem xét và xác minh chức năng. Chúc mừng tác giả! Mặc dù bạn có thể sử dụng miễn phí, hãy nhớ rằng việc công bố lại mã phải tuân theo Nội quy.

Thông báo miễn trừ trách nhiệm
Thông tin và các ấn phẩm này không nhằm mục đích, và không cấu thành, lời khuyên hoặc khuyến nghị về tài chính, đầu tư, giao dịch hay các loại khác do TradingView cung cấp hoặc xác nhận. Đọc thêm tại Điều khoản Sử dụng.
Mã nguồn mở
Theo đúng tinh thần TradingView, tác giả của tập lệnh này đã công bố nó dưới dạng mã nguồn mở, để các nhà giao dịch có thể xem xét và xác minh chức năng. Chúc mừng tác giả! Mặc dù bạn có thể sử dụng miễn phí, hãy nhớ rằng việc công bố lại mã phải tuân theo Nội quy.
Thông báo miễn trừ trách nhiệm
Thông tin và các ấn phẩm này không nhằm mục đích, và không cấu thành, lời khuyên hoặc khuyến nghị về tài chính, đầu tư, giao dịch hay các loại khác do TradingView cung cấp hoặc xác nhận. Đọc thêm tại Điều khoản Sử dụng.