OPEN-SOURCE SCRIPT
Cập nhật FVG Bias Finder [erdensedat]
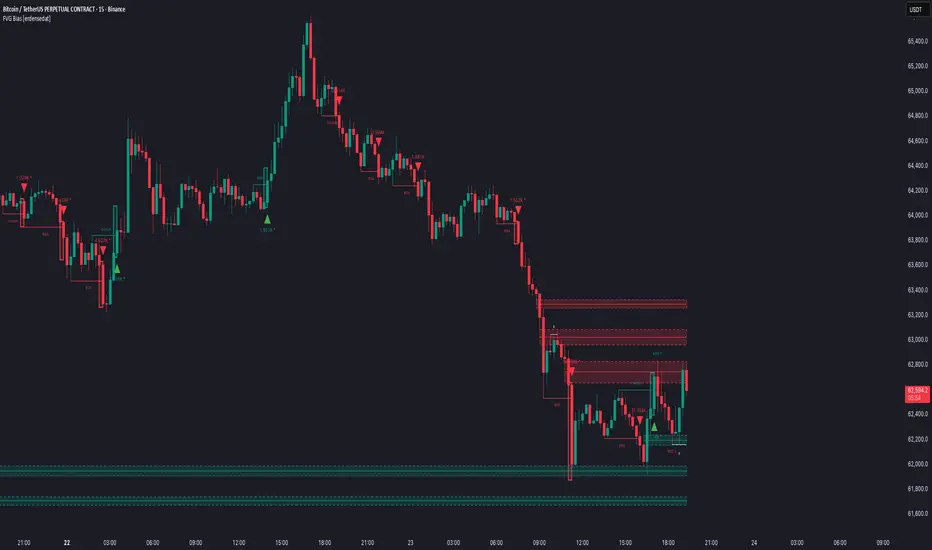
The "FVG Bias Finder [erdensedat]" is an advanced, all-in-one price action toolkit designed to help traders identify structural shifts, market bias, and high-probability zones of interest. By combining core Smart Money Concepts (SMC) such as Break of Structure (BOS), Change of Character (CHoCH), and Fair Value Gaps (FVG), this script provides a clear and objective view of the market trend and institutional footprints.
Key Features & Functionality
Dynamic Market Structure (BOS & CHoCH):
The indicator automatically maps out pivot highs and lows (fractals) to detect structural breaks. Pre-break "candidate" lines help you anticipate incoming structure shifts. Once broken, the lines dynamically change to indicate a confirmed BOS or CHoCH.
High-Volume BOS Detection:
Not all breakouts are equal. The script filters and highlights structural breaks that occur with significant volume (volume exceeding a configurable SMA multiplier). It plots a highlighted zone and prints the exact volume at the breakdown/breakout point, confirming true displacement.
Advanced FVG Engine (erdensedat):
The core of the indicator heavily relies on detecting Fair Value Gaps (FVGs).
Draws bullish and bearish FVGs with customizable lengths and threshold filters based on ATR.
Tracks mitigation logic in real-time (Close, Wick, or Average).
Overlap hiding capabilities to keep your charts clean.
Plots a dynamic SMA trajectory inside the unmitigated gaps to gauge short-term trend strength within the zone.
Bias Directional Signals:
The indicator removes the guesswork by printing explicit Bullish (Green) and Bearish (Red) arrows. A signal is triggered when:
A BOS occurs while a corresponding directional FVG is currently active.
A BOS and a fresh FVG are confirmed on the exact same candle.
This creates high-probability setups, confirming that structural breaks are supported by strong momentum (displacement).
Additional Confluence Tools:
Built-in toggles allow you to overlay VWAP and up to two Moving Averages (SMA, EMA, RMA, WMA, HMA) directly from the indicator settings, eliminating the need to clutter your chart with multiple separate indicators.
How to Use It
Trend Following: Use the BOS/CHoCH mapping in combination with the directional arrows to ride the prevailing trend. When an arrow prints, it signifies that structure has shifted with institutional displacement (FVG).
Entries & Pullbacks: Wait for the price to retrace into the active unmitigated FVG boxes (Bullish Green / Bearish Red zones) following a structural break to find optimal trade entries.
Filtering Noise: Pay close attention to the "High Volume" highlights on the BOS lines. A break of structure backed by high volume implies a stronger likelihood of continuation.
Disclaimer: This script is an analytical tool and does not guarantee future performance. Always use proper risk management.
Key Features & Functionality
Dynamic Market Structure (BOS & CHoCH):
The indicator automatically maps out pivot highs and lows (fractals) to detect structural breaks. Pre-break "candidate" lines help you anticipate incoming structure shifts. Once broken, the lines dynamically change to indicate a confirmed BOS or CHoCH.
High-Volume BOS Detection:
Not all breakouts are equal. The script filters and highlights structural breaks that occur with significant volume (volume exceeding a configurable SMA multiplier). It plots a highlighted zone and prints the exact volume at the breakdown/breakout point, confirming true displacement.
Advanced FVG Engine (erdensedat):
The core of the indicator heavily relies on detecting Fair Value Gaps (FVGs).
Draws bullish and bearish FVGs with customizable lengths and threshold filters based on ATR.
Tracks mitigation logic in real-time (Close, Wick, or Average).
Overlap hiding capabilities to keep your charts clean.
Plots a dynamic SMA trajectory inside the unmitigated gaps to gauge short-term trend strength within the zone.
Bias Directional Signals:
The indicator removes the guesswork by printing explicit Bullish (Green) and Bearish (Red) arrows. A signal is triggered when:
A BOS occurs while a corresponding directional FVG is currently active.
A BOS and a fresh FVG are confirmed on the exact same candle.
This creates high-probability setups, confirming that structural breaks are supported by strong momentum (displacement).
Additional Confluence Tools:
Built-in toggles allow you to overlay VWAP and up to two Moving Averages (SMA, EMA, RMA, WMA, HMA) directly from the indicator settings, eliminating the need to clutter your chart with multiple separate indicators.
How to Use It
Trend Following: Use the BOS/CHoCH mapping in combination with the directional arrows to ride the prevailing trend. When an arrow prints, it signifies that structure has shifted with institutional displacement (FVG).
Entries & Pullbacks: Wait for the price to retrace into the active unmitigated FVG boxes (Bullish Green / Bearish Red zones) following a structural break to find optimal trade entries.
Filtering Noise: Pay close attention to the "High Volume" highlights on the BOS lines. A break of structure backed by high volume implies a stronger likelihood of continuation.
Disclaimer: This script is an analytical tool and does not guarantee future performance. Always use proper risk management.
Phát hành các Ghi chú
changed fvg styleMã nguồn mở
Theo đúng tinh thần TradingView, tác giả của tập lệnh này đã công bố nó dưới dạng mã nguồn mở, để các nhà giao dịch có thể xem xét và xác minh chức năng. Chúc mừng tác giả! Mặc dù bạn có thể sử dụng miễn phí, hãy nhớ rằng việc công bố lại mã phải tuân theo Nội quy.

Thông báo miễn trừ trách nhiệm
Thông tin và các ấn phẩm này không nhằm mục đích, và không cấu thành, lời khuyên hoặc khuyến nghị về tài chính, đầu tư, giao dịch hay các loại khác do TradingView cung cấp hoặc xác nhận. Đọc thêm tại Điều khoản Sử dụng.
Mã nguồn mở
Theo đúng tinh thần TradingView, tác giả của tập lệnh này đã công bố nó dưới dạng mã nguồn mở, để các nhà giao dịch có thể xem xét và xác minh chức năng. Chúc mừng tác giả! Mặc dù bạn có thể sử dụng miễn phí, hãy nhớ rằng việc công bố lại mã phải tuân theo Nội quy.
Thông báo miễn trừ trách nhiệm
Thông tin và các ấn phẩm này không nhằm mục đích, và không cấu thành, lời khuyên hoặc khuyến nghị về tài chính, đầu tư, giao dịch hay các loại khác do TradingView cung cấp hoặc xác nhận. Đọc thêm tại Điều khoản Sử dụng.