OPEN-SOURCE SCRIPT
RSI of Ratio
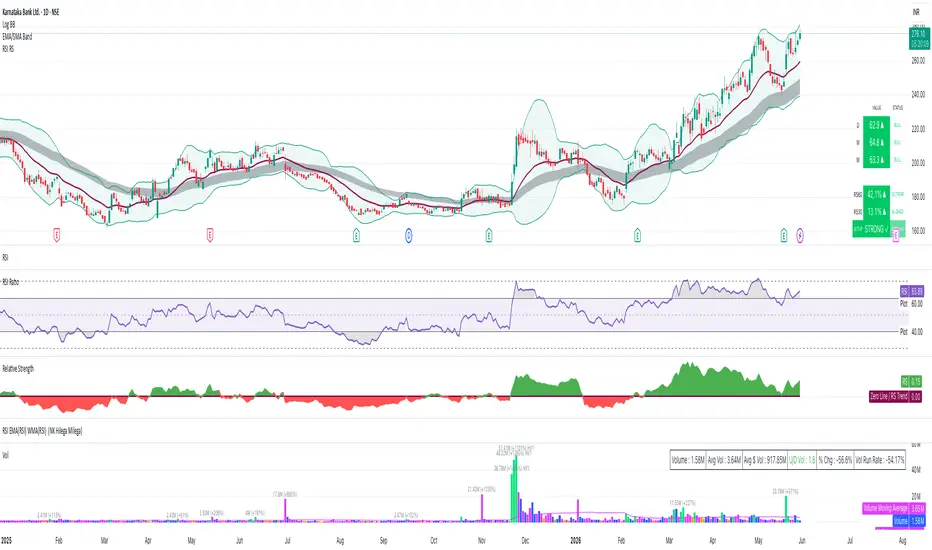
What it does:
Calculates RSI on the ratio of current symbol vs a user-selected compare symbol
(default: NSE:NIFTY). This shows whether the stock is strong or weak relative
to the index.
How to use:
- RSI above 60 → stock outperforming the index (gray dark fill)
- RSI 50–60 → mildly outperforming
- RSI 40–50 → mildly underperforming
- RSI below 40 → stock underperforming the index (gray dark fill)
Settings:
- RSI Length: default 30
- Compare Symbol: any TradingView symbol (Nifty, BTC, SPX, Gold etc)
- All levels adjustable: 70/60/50/40/30
Calculates RSI on the ratio of current symbol vs a user-selected compare symbol
(default: NSE:NIFTY). This shows whether the stock is strong or weak relative
to the index.
How to use:
- RSI above 60 → stock outperforming the index (gray dark fill)
- RSI 50–60 → mildly outperforming
- RSI 40–50 → mildly underperforming
- RSI below 40 → stock underperforming the index (gray dark fill)
Settings:
- RSI Length: default 30
- Compare Symbol: any TradingView symbol (Nifty, BTC, SPX, Gold etc)
- All levels adjustable: 70/60/50/40/30
Mã nguồn mở
Theo đúng tinh thần TradingView, tác giả của tập lệnh này đã công bố nó dưới dạng mã nguồn mở, để các nhà giao dịch có thể xem xét và xác minh chức năng. Chúc mừng tác giả! Mặc dù bạn có thể sử dụng miễn phí, hãy nhớ rằng việc công bố lại mã phải tuân theo Nội quy.

Thông báo miễn trừ trách nhiệm
Thông tin và các ấn phẩm này không nhằm mục đích, và không cấu thành, lời khuyên hoặc khuyến nghị về tài chính, đầu tư, giao dịch hay các loại khác do TradingView cung cấp hoặc xác nhận. Đọc thêm tại Điều khoản Sử dụng.
Mã nguồn mở
Theo đúng tinh thần TradingView, tác giả của tập lệnh này đã công bố nó dưới dạng mã nguồn mở, để các nhà giao dịch có thể xem xét và xác minh chức năng. Chúc mừng tác giả! Mặc dù bạn có thể sử dụng miễn phí, hãy nhớ rằng việc công bố lại mã phải tuân theo Nội quy.
Thông báo miễn trừ trách nhiệm
Thông tin và các ấn phẩm này không nhằm mục đích, và không cấu thành, lời khuyên hoặc khuyến nghị về tài chính, đầu tư, giao dịch hay các loại khác do TradingView cung cấp hoặc xác nhận. Đọc thêm tại Điều khoản Sử dụng.