OPEN-SOURCE SCRIPT
Cập nhật Logit RSI [AdaptiveRSI]
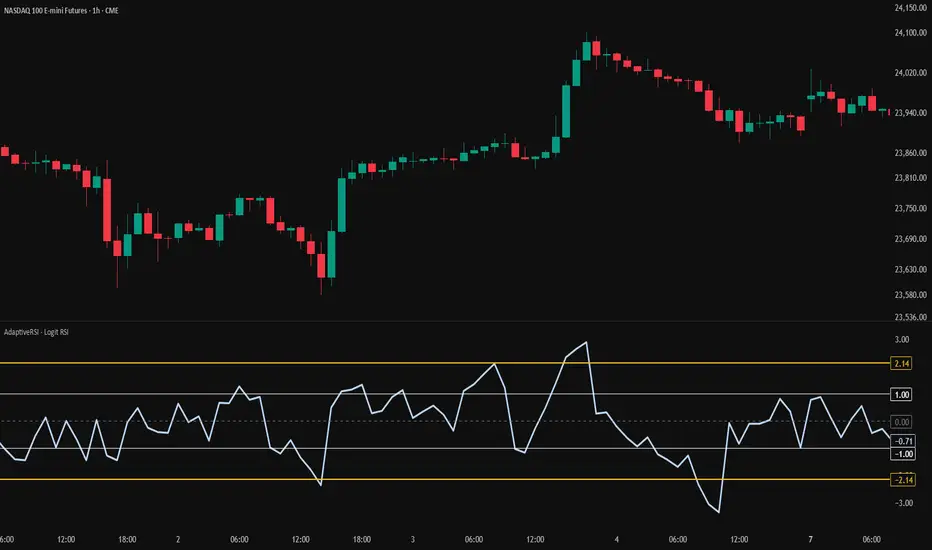
The traditional 0–100 RSI scale makes statistical overlays, such as Bollinger Bands or even moving averages, technically invalid. This script solves this issue by placing RSI on an unbounded, continuous scale, enabling these tools to work as intended.
The Logit function takes bounded data, such as RSI values ranging from 0 to 100, and maps them onto an unbounded scale ranging from negative infinity (−∞) to positive infinity (+∞).
An RSI reading of 50 becomes 0 on the Logit scale, indicating a balanced market. Readings above 50 map to positive Logit values (price above Wilder’s EMA / RSI above 50), while readings below 50 map to negative values (price below Wilder’s EMA / RSI below 50).
For the detailed formula, which calculates RSI as a scaled distance from Wilder’s EMA, check the RSI : alternative derivation script.
The main issue with the 0–100 RSI scale is that different lookback periods produce very different distributions of RSI values. The histograms below illustrate how often RSIs of various lengths spend time within each 5-point range.
On RSI(2), the tallest bars appear at the edges (0–5 and 95–100), meaning short-term RSI spends most of its time at the extremes. For longer lookbacks, the bars cluster around the center and rarely reach 70 or 30.

This behavior makes it difficult to generalize the two most common RSI techniques:
To address this, we apply the Logit Transform:
Logit RSI = LN(RSI / (100 − RSI))
The transformed data fits a smooth bell-shaped curve, allowing statistical tools like Bollinger Bands to function properly for the first time.

Why Logit RSI Matters:
INPUTS:
While simple, the Logit transformation represents an unexplored yet powerful mathematically grounded improvement to the classic RSI.
It offers traders a structured, intuitive, and statistically consistent way to use RSI across all timeframes.
I welcome your feedback, suggestions, and code improvements—especially regarding performance and efficiency. Your insights are greatly appreciated.
The Logit function takes bounded data, such as RSI values ranging from 0 to 100, and maps them onto an unbounded scale ranging from negative infinity (−∞) to positive infinity (+∞).
An RSI reading of 50 becomes 0 on the Logit scale, indicating a balanced market. Readings above 50 map to positive Logit values (price above Wilder’s EMA / RSI above 50), while readings below 50 map to negative values (price below Wilder’s EMA / RSI below 50).
For the detailed formula, which calculates RSI as a scaled distance from Wilder’s EMA, check the RSI : alternative derivation script.
The main issue with the 0–100 RSI scale is that different lookback periods produce very different distributions of RSI values. The histograms below illustrate how often RSIs of various lengths spend time within each 5-point range.
On RSI(2), the tallest bars appear at the edges (0–5 and 95–100), meaning short-term RSI spends most of its time at the extremes. For longer lookbacks, the bars cluster around the center and rarely reach 70 or 30.
This behavior makes it difficult to generalize the two most common RSI techniques:
- Fixed 70/30 thresholds: These overbought and oversold levels only make sense for short- or mid-range lookbacks (around the low teens). For very short periods, RSI spends most of its time above or below these levels, while for long-term lookbacks, RSI rarely reaches them.
- Bollinger Bands (±2 standard deviations): When applied directly to RSI, the bands often extend beyond the 0–100 limits (especially for short-term lookbacks) making them mathematically invalid. While the issue is less visible on longer settings, it remains conceptually incorrect.
To address this, we apply the Logit Transform:
Logit RSI = LN(RSI / (100 − RSI))
The transformed data fits a smooth bell-shaped curve, allowing statistical tools like Bollinger Bands to function properly for the first time.
Why Logit RSI Matters:
- Makes RSI statistically consistent across all lookback periods.
- Greatly improves the visual clarity of short-term RSIs
- Allows proper use of volatility tools (like Bollinger Bands) on RSI.
- Replaces arbitrary 70/30 levels with data-driven thresholds.
- Simplifies RSI interpretation for both short- and long-term analysis.
INPUTS:
- RSI Length — set the RSI lookback period used in calculations.
- RSI Type — choose between Regular RSI or Logit RSI.
- Plot Bollinger Bands — ON/OFF toggle to overlay statistical envelopes around RSI or Logit RSI.
- SMA and Standard Deviation Length — defines the lookback period for both the SMA (Bollinger Bands midline) and Standard Deviation calculations.
- Standard Deviation Multiplier — controls the width of the Bollinger Bands (e.g., 2.0 for ±2σ).
While simple, the Logit transformation represents an unexplored yet powerful mathematically grounded improvement to the classic RSI.
It offers traders a structured, intuitive, and statistically consistent way to use RSI across all timeframes.
I welcome your feedback, suggestions, and code improvements—especially regarding performance and efficiency. Your insights are greatly appreciated.
Phát hành các Ghi chú
- Refactored the Logit transform into a standalone `logit_transform()` function for cleaner structure and easier maintenance.
- No changes to core logic or output; minor formatting and readability improvements.
Phát hành các Ghi chú
This update extends Logit RSI into a more complete “quant version of RSI” by adding a standardized logit mode and optional z-score reference levels.Changes:
• Added a new RSI Plot mode: "standardized logit".
• "Standardized logit" is calculated by dividing Logit RSI by its theoretical length-dependent scale:
standardized logit = Logit RSI / (2 / sqrt(n - 1))
where Logit RSI = logit(RSI / 100), and n is the RSI length.
• This makes RSI readings across different lookback periods easier to compare on a standardized scale.
• Changed the default RSI length from 14 to 2. Short-term RSI most clearly shows the limitations of the traditional 0–100 scale, making it a useful default for Logit RSI.
• Changed the default plot from raw logit to standardized logit.
• Added z-score reference levels, visible only when RSI Plot is set to standardized logit.
• Primary levels are Body (±0.66σ) and Tail (±2.14σ).
• Secondary levels are Breakout (±1.00σ) and Overextension (±√3σ). They are turned off by default to keep the chart cleaner.
• Level values can be adjusted in Inputs. Colors and visibility can be adjusted in the Style tab.
• Bollinger Bands are now optional and turned off by default to avoid visual clutter.
• Regular RSI and raw Logit RSI remain available as comparison modes.
Important note:
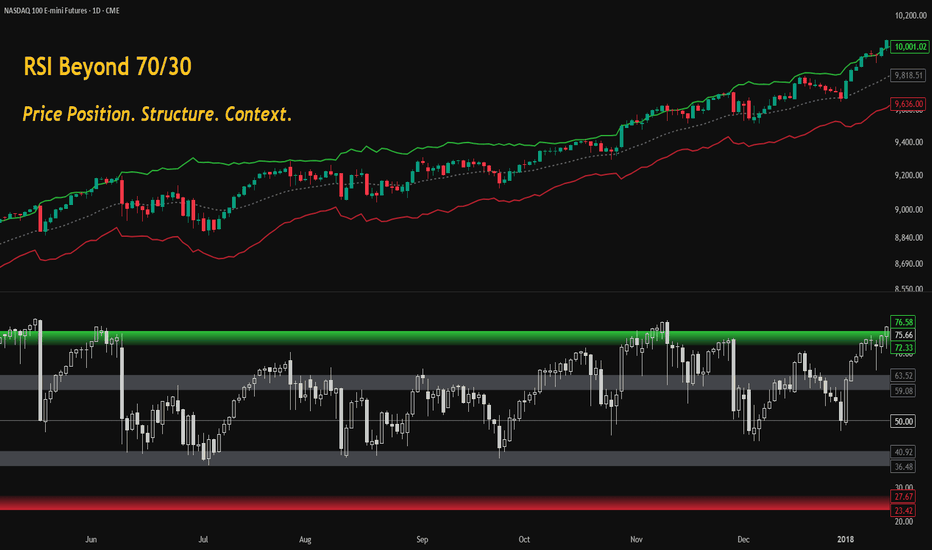
The standardized logit scale should be understood as a length-adjusted analytical scale, not as a guarantee of normal-distribution probabilities or automatic trading signals. For the full framework behind these levels, see RSI Adaptive Zones or the RSI Beyond 70/30 Tutorial:
Mã nguồn mở
Theo đúng tinh thần TradingView, tác giả của tập lệnh này đã công bố nó dưới dạng mã nguồn mở, để các nhà giao dịch có thể xem xét và xác minh chức năng. Chúc mừng tác giả! Mặc dù bạn có thể sử dụng miễn phí, hãy nhớ rằng việc công bố lại mã phải tuân theo Nội quy.

New: "RSI Manifesto v2.0" — free 38-page download
adaptiversi.gumroad.com/l/evrgfw
Video tutorials:
youtube.com/@adaptiveRSI
adaptiversi.gumroad.com/l/evrgfw
Video tutorials:
youtube.com/@adaptiveRSI
Thông báo miễn trừ trách nhiệm
Thông tin và các ấn phẩm này không nhằm mục đích, và không cấu thành, lời khuyên hoặc khuyến nghị về tài chính, đầu tư, giao dịch hay các loại khác do TradingView cung cấp hoặc xác nhận. Đọc thêm tại Điều khoản Sử dụng.
Mã nguồn mở
Theo đúng tinh thần TradingView, tác giả của tập lệnh này đã công bố nó dưới dạng mã nguồn mở, để các nhà giao dịch có thể xem xét và xác minh chức năng. Chúc mừng tác giả! Mặc dù bạn có thể sử dụng miễn phí, hãy nhớ rằng việc công bố lại mã phải tuân theo Nội quy.
New: "RSI Manifesto v2.0" — free 38-page download
adaptiversi.gumroad.com/l/evrgfw
Video tutorials:
youtube.com/@adaptiveRSI
adaptiversi.gumroad.com/l/evrgfw
Video tutorials:
youtube.com/@adaptiveRSI
Thông báo miễn trừ trách nhiệm
Thông tin và các ấn phẩm này không nhằm mục đích, và không cấu thành, lời khuyên hoặc khuyến nghị về tài chính, đầu tư, giao dịch hay các loại khác do TradingView cung cấp hoặc xác nhận. Đọc thêm tại Điều khoản Sử dụng.