34 EMA Bands [v2]
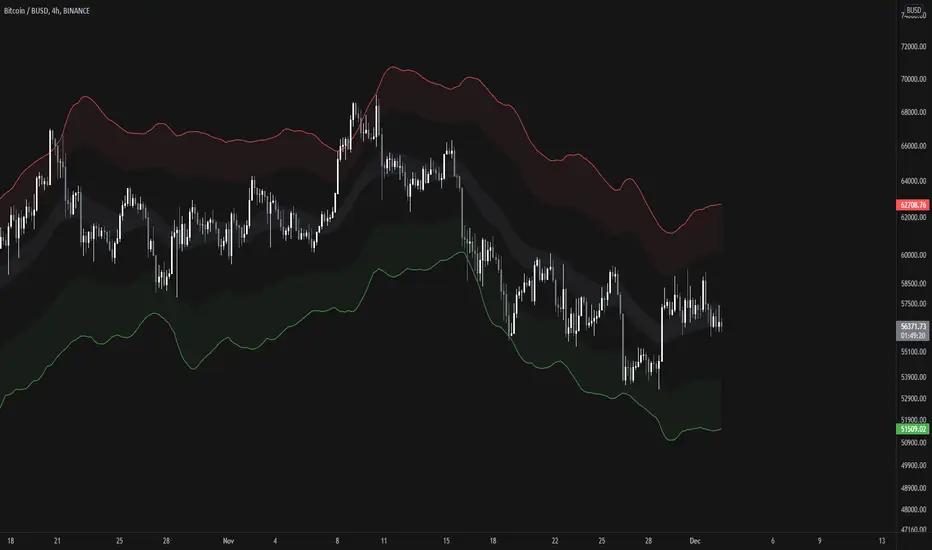
Updating an older concept here with some more oversold/overbought zones.
Pretty self explanatory, red zone indicate overbought zones and green zone is a oversold. Often, price likes to bounce off of the lower bounds of these zones, but it can sometimes extend all the way through the zone onto the upper boundary.
There are many lines to this indicator, i prefer using it with all the lines off except the outermost ones. However, you can edit it if it suits you better.
Source code is open, so any suggestions to improve its accuracy are welcome :)
Phát hành các Ghi chú
Cleaned up the code, and added option to have different TFs
Thông báo miễn trừ trách nhiệm
Thông tin và các ấn phẩm này không nhằm mục đích, và không cấu thành, lời khuyên hoặc khuyến nghị về tài chính, đầu tư, giao dịch hay các loại khác do TradingView cung cấp hoặc xác nhận. Đọc thêm tại Điều khoản Sử dụng.
Thông báo miễn trừ trách nhiệm
Thông tin và các ấn phẩm này không nhằm mục đích, và không cấu thành, lời khuyên hoặc khuyến nghị về tài chính, đầu tư, giao dịch hay các loại khác do TradingView cung cấp hoặc xác nhận. Đọc thêm tại Điều khoản Sử dụng.