Cập nhật
Regime Dashboard (SPX / NDX / R2K / BTC / Miners / Custom)
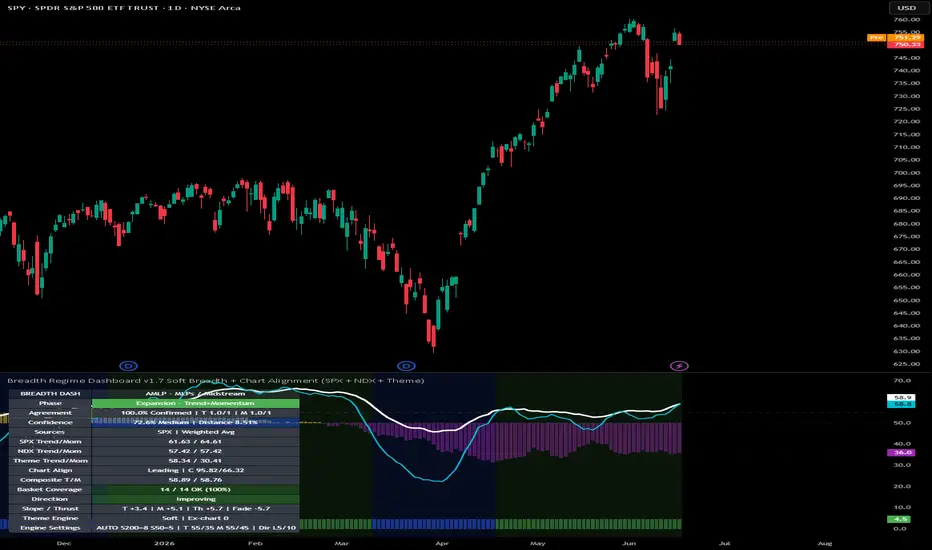
Regime Dashboard (SPX / NDX / BTC / Miners) is a market “risk regime” + breadth dashboard designed to help you avoid fighting the tape and improve timing for swings and longer holds.
This indicator does not forecast price. It measures participation / trend-health in a chosen universe and converts it into a simple RISK ON / RISK OFF regime using a smoothed breadth + hysteresis (two-threshold) engine to reduce chop.
What it measures (by mode)
1) SPX Breadth
Uses TradingView breadth symbols for the S&P 500:
% Above 200D (long-term trend participation)
% Above 50D (short-term participation)
2) Nasdaq-100 Breadth
Same concept, but for the Nasdaq-100:
% Above 200D
% Above 50D
3) BTC Trend (proxy)
BTC doesn’t have “% of components above MA”, so the indicator uses a binary trend proxy:
BTC > 200D SMA → 100, else 0
BTC > 50D SMA → 100, else 0
Smoothing turns this into a “persistence” metric (how consistently BTC stays above its long MA).
4) Miner Basket Breadth
Builds a custom basket (e.g., MARA/RIOT/CLSK/WULF/HIVE/CIFR/IREN/BTDR/HUT) and computes:
b200: % of selected miners above their own 200D SMA
b50: % above their own 50D SMA
Because baskets are smaller and step-like, this mode typically needs stronger smoothing/hysteresis.
The 3 plotted lines
200 (raw) (red): long-term participation / trend health
50 (raw) (blue): short-term participation / momentum health
Smooth(200) (white): SMA of the red line, used for regime decisions
Risk regime engine (sticky + smoothed)
Regime is determined by Smooth(200) with two thresholds (hysteresis):
If Smooth(200) ≥ Risk-ON threshold → RISK ON
If Smooth(200) ≤ Risk-OFF threshold → RISK OFF
Between thresholds → regime stays the same (“sticky”) to avoid frequent flipping.
HUD dashboard
A compact table shows:
Active mode (SPX / NDX / BTC / Miners)
Current regime (RISK ON/OFF)
200 raw / 50 raw / smoothed 200
Current parameters (smoothing + thresholds)
What it’s for
Align trades with risk conditions
Improve entry timing by waiting for breadth confirmation
Avoid “bottom picking” when the market/sector is in RISK OFF
Press winners harder when participation supports continuation
Step-by-step: How to Use It (Playbook)
Step 1 — Pick the correct mode for what you trade
Use the universe that drives your ticker:
Large caps / general equities: SPX Breadth
Tech / growth: Nasdaq-100 Breadth
Crypto exposure: BTC Trend (proxy)
Miners / BTC-linked stocks: Miner Basket Breadth
Rule: If your ticker is a “pack trade” (miners/biotech/spec small caps), use the pack’s breadth, not SPX alone.
Step 2 — Use the regime shading as your “aggression switch”
RISK ON (green background)
Favor longs / adds on pullbacks
Allow wider stops / longer holds
Expect breakouts and trend continuation to work more often
RISK OFF (red background)
Reduce size, tighten risk, take profits faster
Be skeptical of breakouts
Bottom-fishing is lower probability; prefer waiting for regime improvement
This is the core point: your strategy changes with regime.
Step 3 — Understand what the lines mean (mechanically)
Blue (50 raw) = short-term participation
Moves first at turns
Good for early “is selling pressure easing?” signals
Red (200 raw) = long-term participation
Defines whether the universe is broadly in a long-term uptrend vs downtrend
More stable, but slower to turn
White (Smooth(200)) = the decision engine
Filters noise in the red line
Prevents regime from flipping on small, temporary changes
Step 4 — Bottom timing sequence (highest probability)
For bottoms, watch the internal sequence:
RISK OFF + blue line depressed
→ the universe is weak; rallies are often “dead-cat bounces”
Blue (50) turns up (higher lows / rising trend)
→ early evidence the group is improving
Red (200) stabilizes + Smooth(200) rises
→ long-term participation starts recovering
Smooth(200) crosses above Risk-ON threshold
→ regime flips to RISK ON (confirmation that tends to last)
Use it like this:
Early entry attempts: only if you accept higher risk
Higher-probability entries: after step 2 or step 4 depending on your style
Step 5 — Trend continuation and “add points”
In RISK ON:
Adds on pullbacks work best when:
blue line stays above ~50 and/or is rising
Smooth(200) remains above the ON threshold (no loss of regime)
In RISK OFF:
Treat rallies as tactical unless internals improve.
Step 6 — Suggested starting settings (by mode)
These are starting points, not gospel.
SPX / NDX
SmoothLen: 3–5
ON/OFF: 55 / 35 (or similar)
Miners basket
SmoothLen: 7–14 (often needed because basket is step-like)
ON/OFF: 60 / 40 (wider band reduces whipsaw)
BTC proxy
SmoothLen: 10–20
ON/OFF: depends on how strict you want “trend persistence” to be
(Higher smoothing = fewer flips)
Important Notes
Breadth symbols vary by TradingView data access. If a symbol doesn’t exist on your plan, replace it in inputs.
Miner baskets are sample-based: small baskets move in steps (e.g., 1/9 ≈ 11.1%). That’s normal.
This tool is a context filter, not a standalone trading system. Use with your price structure (S/R, AVWAP, volume profile, trend MAs) for entries/exits.
“Quick Start” (2 rules)
Only press longs in RISK ON.
When hunting bottoms, watch blue (50) turn first, then wait for Smooth(200) confirmation if you want higher win-rate.
This indicator does not forecast price. It measures participation / trend-health in a chosen universe and converts it into a simple RISK ON / RISK OFF regime using a smoothed breadth + hysteresis (two-threshold) engine to reduce chop.
What it measures (by mode)
1) SPX Breadth
Uses TradingView breadth symbols for the S&P 500:
% Above 200D (long-term trend participation)
% Above 50D (short-term participation)
2) Nasdaq-100 Breadth
Same concept, but for the Nasdaq-100:
% Above 200D
% Above 50D
3) BTC Trend (proxy)
BTC doesn’t have “% of components above MA”, so the indicator uses a binary trend proxy:
BTC > 200D SMA → 100, else 0
BTC > 50D SMA → 100, else 0
Smoothing turns this into a “persistence” metric (how consistently BTC stays above its long MA).
4) Miner Basket Breadth
Builds a custom basket (e.g., MARA/RIOT/CLSK/WULF/HIVE/CIFR/IREN/BTDR/HUT) and computes:
b200: % of selected miners above their own 200D SMA
b50: % above their own 50D SMA
Because baskets are smaller and step-like, this mode typically needs stronger smoothing/hysteresis.
The 3 plotted lines
200 (raw) (red): long-term participation / trend health
50 (raw) (blue): short-term participation / momentum health
Smooth(200) (white): SMA of the red line, used for regime decisions
Risk regime engine (sticky + smoothed)
Regime is determined by Smooth(200) with two thresholds (hysteresis):
If Smooth(200) ≥ Risk-ON threshold → RISK ON
If Smooth(200) ≤ Risk-OFF threshold → RISK OFF
Between thresholds → regime stays the same (“sticky”) to avoid frequent flipping.
HUD dashboard
A compact table shows:
Active mode (SPX / NDX / BTC / Miners)
Current regime (RISK ON/OFF)
200 raw / 50 raw / smoothed 200
Current parameters (smoothing + thresholds)
What it’s for
Align trades with risk conditions
Improve entry timing by waiting for breadth confirmation
Avoid “bottom picking” when the market/sector is in RISK OFF
Press winners harder when participation supports continuation
Step-by-step: How to Use It (Playbook)
Step 1 — Pick the correct mode for what you trade
Use the universe that drives your ticker:
Large caps / general equities: SPX Breadth
Tech / growth: Nasdaq-100 Breadth
Crypto exposure: BTC Trend (proxy)
Miners / BTC-linked stocks: Miner Basket Breadth
Rule: If your ticker is a “pack trade” (miners/biotech/spec small caps), use the pack’s breadth, not SPX alone.
Step 2 — Use the regime shading as your “aggression switch”
RISK ON (green background)
Favor longs / adds on pullbacks
Allow wider stops / longer holds
Expect breakouts and trend continuation to work more often
RISK OFF (red background)
Reduce size, tighten risk, take profits faster
Be skeptical of breakouts
Bottom-fishing is lower probability; prefer waiting for regime improvement
This is the core point: your strategy changes with regime.
Step 3 — Understand what the lines mean (mechanically)
Blue (50 raw) = short-term participation
Moves first at turns
Good for early “is selling pressure easing?” signals
Red (200 raw) = long-term participation
Defines whether the universe is broadly in a long-term uptrend vs downtrend
More stable, but slower to turn
White (Smooth(200)) = the decision engine
Filters noise in the red line
Prevents regime from flipping on small, temporary changes
Step 4 — Bottom timing sequence (highest probability)
For bottoms, watch the internal sequence:
RISK OFF + blue line depressed
→ the universe is weak; rallies are often “dead-cat bounces”
Blue (50) turns up (higher lows / rising trend)
→ early evidence the group is improving
Red (200) stabilizes + Smooth(200) rises
→ long-term participation starts recovering
Smooth(200) crosses above Risk-ON threshold
→ regime flips to RISK ON (confirmation that tends to last)
Use it like this:
Early entry attempts: only if you accept higher risk
Higher-probability entries: after step 2 or step 4 depending on your style
Step 5 — Trend continuation and “add points”
In RISK ON:
Adds on pullbacks work best when:
blue line stays above ~50 and/or is rising
Smooth(200) remains above the ON threshold (no loss of regime)
In RISK OFF:
Treat rallies as tactical unless internals improve.
Step 6 — Suggested starting settings (by mode)
These are starting points, not gospel.
SPX / NDX
SmoothLen: 3–5
ON/OFF: 55 / 35 (or similar)
Miners basket
SmoothLen: 7–14 (often needed because basket is step-like)
ON/OFF: 60 / 40 (wider band reduces whipsaw)
BTC proxy
SmoothLen: 10–20
ON/OFF: depends on how strict you want “trend persistence” to be
(Higher smoothing = fewer flips)
Important Notes
Breadth symbols vary by TradingView data access. If a symbol doesn’t exist on your plan, replace it in inputs.
Miner baskets are sample-based: small baskets move in steps (e.g., 1/9 ≈ 11.1%). That’s normal.
This tool is a context filter, not a standalone trading system. Use with your price structure (S/R, AVWAP, volume profile, trend MAs) for entries/exits.
“Quick Start” (2 rules)
Only press longs in RISK ON.
When hunting bottoms, watch blue (50) turn first, then wait for Smooth(200) confirmation if you want higher win-rate.
Phát hành các Ghi chú
Breadth Regime DashboardThis indicator measures market, Nasdaq, and theme breadth to help determine whether the broader environment supports or opposes a trade idea.
It is not a buy/sell signal. Use it as a regime and participation filter alongside price action and risk management.
What’s New
1. SPX + NDX + Theme Composite
Combines three breadth sources:
• SPX breadth
• NDX breadth
• Selected theme breadth
Combine methods:
• Median 2-of-3
• Weighted Average
2. Theme Breadth Engine
Includes a large library of sectors and themes such as Technology, Semiconductors, AI, Crypto, Energy, Health Care, Cybersecurity, Defense, Solar, and more.
Breadth is based on the percentage of stocks above their:
• 200-day MA (trend)
• 50-day MA (momentum)
3. Four Regimes
• Expansion – trend and momentum strong
• Trend OK / Pullback – trend intact, momentum cooling
• Bear Rally Risk – momentum improving, trend weak
• Contraction – trend and momentum weak
4. Sticky Regime Logic
Uses separate ON/OFF thresholds to reduce noisy regime flips.
5. Auto Parameters
Automatically adjusts smoothing and thresholds based on basket size.
6. Voting Modes
• Binary
• Soft
• Hybrid
7. Agreement & Confidence
Measures agreement between SPX, NDX, and Theme breadth.
Higher agreement = stronger regime signal.
8. Direction Layer
Tracks:
• Slope
• Thrust
• Fade
9. Chart Symbol Alignment
Compares the current chart symbol to its selected theme:
• Confirmed +
• Leading
• Lagging
• Confirmed -
• No Data
10. Exclude Current Symbol
Optionally removes the chart symbol from the theme basket to avoid self-confirmation.
11. Coverage & Data Quality
Shows how many basket symbols have valid data.
Low coverage reduces reliability.
12. Dashboard Table
Displays:
• Theme
• Regime
• Trend & momentum
• Agreement/confidence
• Coverage
• Direction
• Settings
How to Use
1. Select the Correct Theme
Choose the theme that best matches the stock's primary driver.
Examples:
• NVDA → Semiconductors, AI
• COIN → Crypto Innovators
• LLY → Health Care
• XOM → Energy
• PLTR → AI, Cybersecurity
2. Read the Regime
Expansion
Most supportive environment for long setups and trend continuation.
Trend OK / Pullback
Trend remains healthy but momentum is cooling.
Bear Rally Risk
Short-term improvement inside a weak longer-term structure.
Contraction
Weak participation and the least favorable environment for aggressive longs.
3. Check Trend & Momentum
Strong conditions:
• Rising Smooth 200
• Rising Smooth 50
• Improving theme breadth
• Improving agreement
Weak conditions:
• Falling Smooth 200
• Falling Smooth 50
• Weak breadth
• Weak agreement
4. Check Agreement
Higher confidence generally comes from:
• Expansion or Trend OK / Pullback
• Strong agreement
• Good basket coverage
• Positive direction
5. Check Alignment
• Confirmed + = stock and theme strong
• Leading = stock stronger than theme
• Lagging = theme stronger than stock
• Confirmed - = both weak
6. Use Price Action
Suggested workflow:
1. Check regime.
2. Check theme breadth.
3. Check agreement/confidence.
4. Check stock-theme alignment.
5. Use price action for entries and exits.
Recommended Settings
General Use
• Timeframe: 1D
• Range: 1Y
• SPX: ON
• NDX: ON
• Theme: ON
• Auto Parameters: ON
• Vote Mode: Hybrid
Broad Market
• Chart: SPY or QQQ
• Combine Method: Median 2-of-3
Single Stocks
• Combine Method: Weighted Average
• Exclude Current Symbol: ON
• Vote Mode: Hybrid
Limitations
This indicator does not predict price.
It measures breadth, participation, agreement, and regime quality. Strong regimes can fail, and weak regimes can still produce rallies.
Theme selection and basket coverage matter.
Best Use Case
Use this indicator to identify when market, Nasdaq, and theme breadth are aligned and to improve trade context for swing and trend trading.
Price first.
Regime second.
Risk management always.

Researching companies, industries & charts with custom indicators. This is not financial advice.
Thông báo miễn trừ trách nhiệm
Thông tin và các ấn phẩm này không nhằm mục đích, và không cấu thành, lời khuyên hoặc khuyến nghị về tài chính, đầu tư, giao dịch hay các loại khác do TradingView cung cấp hoặc xác nhận. Đọc thêm tại Điều khoản Sử dụng.
Researching companies, industries & charts with custom indicators. This is not financial advice.
Thông báo miễn trừ trách nhiệm
Thông tin và các ấn phẩm này không nhằm mục đích, và không cấu thành, lời khuyên hoặc khuyến nghị về tài chính, đầu tư, giao dịch hay các loại khác do TradingView cung cấp hoặc xác nhận. Đọc thêm tại Điều khoản Sử dụng.