OPEN-SOURCE SCRIPT
GBR Smart Volume Delta [Absorption & Traps]
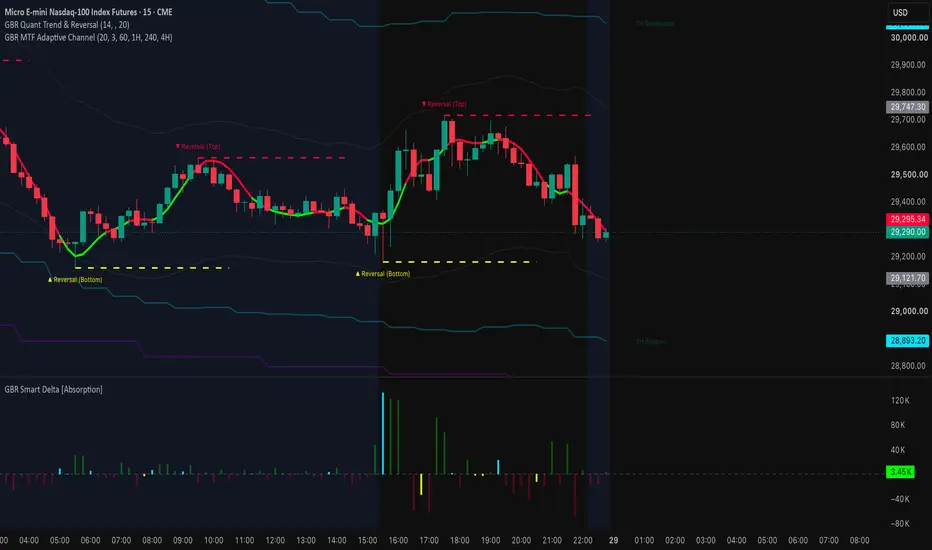
The traditional Volume Delta indicator is fundamentally flawed for modern day trading. It only calculates aggressive market orders, completely blinding you to the passive institutional limit orders (icebergs) that actually stop the price.
The GBR Smart Delta doesn't just count orders; it thinks. It analyzes the relationship between raw delta and the actual candlestick close to detect Institutional Absorption in real-time.
🔥 Core Features & Visual Logic:
Trap Detection: Exposes moments when retail traders are aggressively selling, but the price refuses to drop (or leaves a massive wick).
💥 UV Yellow (Bear Trap / Bullish Absorption): Delta is negative (heavy selling), but the candle closes bullish or forms a hammer. Passive buyers are absorbing the selling pressure. Prime long opportunity.
💥 UV Cyan (Bull Trap / Bearish Absorption): Delta is positive (heavy buying), but the candle closes bearish or forms a shooting star. Passive sellers have built a wall. Prime short opportunity.
Faint Colors for Normalcy: When price and volume agree, the histogram uses muted Green (70% transparent) and muted Red to keep your focus strictly on the anomalies.
Zero Clutter: No moving averages on the volume, no unnecessary lines. Just raw data and high-visibility trap signals.
🎯 How to execute:
Never trade delta in a vacuum. Wait for price to reach a major Support/Resistance level. If you see a bright UV Yellow or UV Cyan spike at these key structural zones, you know the Smart Money has stepped in. Enter with them.
The GBR Smart Delta doesn't just count orders; it thinks. It analyzes the relationship between raw delta and the actual candlestick close to detect Institutional Absorption in real-time.
🔥 Core Features & Visual Logic:
Trap Detection: Exposes moments when retail traders are aggressively selling, but the price refuses to drop (or leaves a massive wick).
💥 UV Yellow (Bear Trap / Bullish Absorption): Delta is negative (heavy selling), but the candle closes bullish or forms a hammer. Passive buyers are absorbing the selling pressure. Prime long opportunity.
💥 UV Cyan (Bull Trap / Bearish Absorption): Delta is positive (heavy buying), but the candle closes bearish or forms a shooting star. Passive sellers have built a wall. Prime short opportunity.
Faint Colors for Normalcy: When price and volume agree, the histogram uses muted Green (70% transparent) and muted Red to keep your focus strictly on the anomalies.
Zero Clutter: No moving averages on the volume, no unnecessary lines. Just raw data and high-visibility trap signals.
🎯 How to execute:
Never trade delta in a vacuum. Wait for price to reach a major Support/Resistance level. If you see a bright UV Yellow or UV Cyan spike at these key structural zones, you know the Smart Money has stepped in. Enter with them.
Mã nguồn mở
Theo đúng tinh thần TradingView, tác giả của tập lệnh này đã công bố nó dưới dạng mã nguồn mở, để các nhà giao dịch có thể xem xét và xác minh chức năng. Chúc mừng tác giả! Mặc dù bạn có thể sử dụng miễn phí, hãy nhớ rằng việc công bố lại mã phải tuân theo Nội quy.

Thông báo miễn trừ trách nhiệm
Thông tin và các ấn phẩm này không nhằm mục đích, và không cấu thành, lời khuyên hoặc khuyến nghị về tài chính, đầu tư, giao dịch hay các loại khác do TradingView cung cấp hoặc xác nhận. Đọc thêm tại Điều khoản Sử dụng.
Mã nguồn mở
Theo đúng tinh thần TradingView, tác giả của tập lệnh này đã công bố nó dưới dạng mã nguồn mở, để các nhà giao dịch có thể xem xét và xác minh chức năng. Chúc mừng tác giả! Mặc dù bạn có thể sử dụng miễn phí, hãy nhớ rằng việc công bố lại mã phải tuân theo Nội quy.
Thông báo miễn trừ trách nhiệm
Thông tin và các ấn phẩm này không nhằm mục đích, và không cấu thành, lời khuyên hoặc khuyến nghị về tài chính, đầu tư, giao dịch hay các loại khác do TradingView cung cấp hoặc xác nhận. Đọc thêm tại Điều khoản Sử dụng.