OPEN-SOURCE SCRIPT
VP + Smart HiLo [I.M]
🟣 Overview
Volume Profile + Smart HiLo Engine ("HLS+ [I.M]") is a discretionary context tool that unifies three complementary structure components into a single overlay: a progressive HiLo Stairs structure, a clean Volume Profile reference panel (POC / VAH / VAL), and a confluence-filtered Smart HiLo Engine with adaptive ribbon and force-scored flip signals.
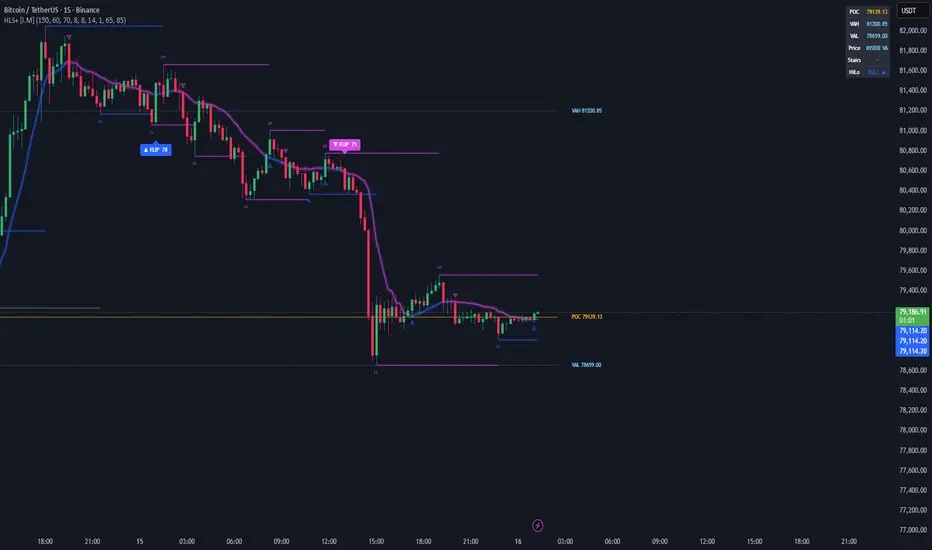
The screenshot below shows everything working together on BTCUSDT (Binance) on the 15-minute timeframe — refer back to it throughout the description, since each section refers to the same chart.
📊 Live example chart:
🟣 What You See on the Chart
Looking at the example image:
- The blue / purple ribbon flowing through the candles is the Smart HiLo ribbon. Blue means HiLo state is bullish (close above the adaptive HiLo channel), purple means bearish. Rendered as a 3-layer glow for clarity without dominating the chart.
- Each "FLIP" label with a force number (e.g. "FLIP 71") is a confluence-qualified flip — the ribbon changed direction AND the move passed both the force threshold and the POC confluence filter. Low-quality flips appear as small discreet triangles only.
- A "★ STRONG BEAR ★" or "★ STRONG BULL ★" highlight (e.g. "Force 91" in the example) is a premium signal: force score reached the premium threshold (default 85), indicating strong alignment of volume, body and ATR distance.
- The horizontal stair levels labeled HH / HL / LH / LL are the HiLo Stairs — progressive swing levels. Blue stairs mean higher highs / higher lows (bullish), purple stairs mean lower highs / lower lows (bearish). Each stair has a subtle halo glow.
- The side labels "POC", "VAH" and "VAL" on the right edge show the current Point of Control and Value Area boundaries of the rolling Volume Profile, with precise prices. Their dashed/dotted lines extend back across the lookback window.
- The info panel in the top-right corner shows POC, VAH, VAL, where price sits relative to the Value Area, Stairs direction, and HiLo ribbon direction.
🟣 What Makes It Original
HLS+ [I.M] is not a wrapper around the classic Gann HiLo Activator or a standard Volume Profile. The originality is in how three independent layers are combined and filtered:
Adaptive HiLo channel with volatility-aware length
The HiLo channel length adjusts automatically to current volatility (ATR(14) vs SMA of ATR(50)). In calm regimes the channel tightens, in volatile regimes it widens. This adaptive length produces a ribbon that does not whipsaw in compressed markets and does not lag in expansion.
Force-scored flips with POC confluence filter
Every direction flip is scored 0-100 from three components — volume vs average, candle body ratio, and ATR distance. The score alone is not enough: the flip must also pass a POC confluence filter (bullish flips require price near or above the rolling POC, bearish flips require price near or below). Flips failing either gate are demoted to small discreet markers.
Progressive HiLo Stairs structure
Stairs are stored as typed arrays of pivot highs and lows. Each step is classified as HH / HL (bullish progression) or LH / LL (bearish progression) by comparing to the previous swing of the same kind. The overall stairs trend is derived from the relationship between the last two highs AND lows together, not from a single swing.
Volume Profile as silent reference
The Volume Profile rolling lookback is computed but only POC, VAH and VAL are exposed as visual references — no histogram clutter. These act as liquidity anchors that the HiLo flips reference for confluence.
🟣 How It Works — Step by Step
1. Volume Profile
The script builds a rolling volume distribution over the configurable lookback (default 150 bars, 60 rows). For each bar it spreads volume across the rows the bar's high-low range overlaps. The row with the highest volume is the POC. VAH and VAL are computed by expanding outward from the POC until cumulative volume reaches the chosen percentage (default 70%).
2. HiLo Stairs collection
Pivots are detected using ta.pivothigh and ta.pivotlow with the chosen pivot length (default 8). Each pivot is pushed into a typed array, capped at the chosen maximum (default 8 each side).
3. Stairs classification
Each pivot is compared to the previous one of the same kind:
- Higher high vs previous high → HH (blue)
- Lower high vs previous high → LH (purple)
Same logic applies to lows (HL vs LL).
4. Adaptive HiLo channel
The base HiLo length (default 14) is multiplied by a volatility factor:
adaptLen = base × (1 + (1 - ATR/SMA(ATR,50)) × adaptiveFactor)
The result is used to compute SMA(high) and SMA(low) — the upper and lower bands. The ribbon is the midpoint.
5. Direction state machine
Internal state: +1 when close crosses above the upper band, -1 when close crosses below the lower band. The ribbon color follows this state. Any change triggers a flip candidate.
6. Force Score
On each flip, three sub-scores are computed:
- Volume score (0-40): current volume vs 20-bar SMA
- Body score (0-30): |close - open| / (high - low) × 30
- ATR distance score (0-30): |close - open| / ATR × 15
Total is the sum (0-100).
7. POC confluence gate
Bullish flips require (close - POC) / ATR > -0.3 (price at or above POC, or at most 0.3 ATR below).
Bearish flips require (close - POC) / ATR < 0.3 (price at or below POC, or at most 0.3 ATR above).
Flips passing both force threshold AND confluence get the FLIP label. Flips passing the premium threshold (default 85) get the ★ STRONG ★ highlight. Flips failing either gate appear as small triangles only.
🟣 How to Use
HLS+ [I.M] is designed as a context tool, not a black-box buy/sell system.
1. Read the panel first. Stairs direction and HiLo direction together give you the structural bias. When both agree, the environment is aligned.
2. Use POC / VAH / VAL as liquidity anchors. Trade decisions tend to make more sense at or near these levels than in the middle of the Value Area.
3. Treat the FLIP signal as a confluence event, not a trigger. A FLIP means structure, force and POC confluence agreed — but you still apply your own entry rules, sizing and risk management.
4. STRONG signals (Force ≥ 85) are intentionally rare. They indicate strong alignment of volume, momentum and structure. Use them as higher-conviction entries when they appear with the broader stairs direction.
5. Mismatch is information. If the HiLo flips bullish but Stairs is still BEAR, treat it as an early signal needing confirmation — not a full reversal.
The script does not place orders, does not include backtest results, and does not claim a win rate. All decisions remain with the trader.
🟣 Inputs
Volume Profile Levels
- Lookback (bars) — rolling window for the profile (default 150)
- Profile Rows — vertical resolution of the distribution (default 60)
- Value Area % — VAH/VAL coverage of total volume (default 70)
HiLo Stairs
- Pivot Length — bars on each side required for a pivot (default 8)
- Max stairs steps — array cap to keep the script light (default 8)
- Show HH/HL/LH/LL labels — toggle the stair labels
Smart HiLo Engine
- Show Ribbon — toggle the adaptive ribbon
- HiLo Length — base length of the HiLo channel (default 14)
- ATR Adaptive Factor — how much the length reacts to volatility (default 1.0)
- Min Force Score for label — flip threshold for the FLIP label (default 65)
- Premium Force Threshold — flip threshold for the ★ STRONG ★ highlight (default 85)
- Show HiLo Bands — optional channel bands (off by default)
Visual
- Full color customization (POC, VAH/VAL, Bull, Bear)
- Show Info Panel — toggle the top-right context table
🟣 Alerts
Built-in alerts:
- Qualified Bull Flip — confluence-qualified bullish flip
- Qualified Bear Flip — confluence-qualified bearish flip
- Premium Bull Flip — premium-grade bullish flip (Force ≥ 85)
- Premium Bear Flip — premium-grade bearish flip (Force ≥ 85)
🟣 Notes and Limitations
- All structural logic is evaluated on bar close. Intra-bar values may differ from the final, confirmed reading.
- Volume-based force scoring depends on the symbol providing usable volume data. On instruments without reliable volume, the force component will be less informative.
- The Force Score is a heuristic aid, not a probability. Different markets and timeframes will live in different score ranges, and that is expected.
- POC / VAH / VAL are computed from a rolling lookback and will shift as new data arrives. This is by design — they are dynamic liquidity references, not fixed levels.
🟣 Disclaimer
This script is published for educational and informational purposes only. It is not financial advice and does not guarantee any particular outcome. Past behaviour of the indicator on historical data does not imply future performance. Trade at your own risk and size positions according to your own risk management.
Mã nguồn mở
Theo đúng tinh thần TradingView, tác giả của tập lệnh này đã công bố nó dưới dạng mã nguồn mở, để các nhà giao dịch có thể xem xét và xác minh chức năng. Chúc mừng tác giả! Mặc dù bạn có thể sử dụng miễn phí, hãy nhớ rằng việc công bố lại mã phải tuân theo Nội quy.

Thông báo miễn trừ trách nhiệm
Thông tin và các ấn phẩm này không nhằm mục đích, và không cấu thành, lời khuyên hoặc khuyến nghị về tài chính, đầu tư, giao dịch hay các loại khác do TradingView cung cấp hoặc xác nhận. Đọc thêm tại Điều khoản Sử dụng.
Mã nguồn mở
Theo đúng tinh thần TradingView, tác giả của tập lệnh này đã công bố nó dưới dạng mã nguồn mở, để các nhà giao dịch có thể xem xét và xác minh chức năng. Chúc mừng tác giả! Mặc dù bạn có thể sử dụng miễn phí, hãy nhớ rằng việc công bố lại mã phải tuân theo Nội quy.
Thông báo miễn trừ trách nhiệm
Thông tin và các ấn phẩm này không nhằm mục đích, và không cấu thành, lời khuyên hoặc khuyến nghị về tài chính, đầu tư, giao dịch hay các loại khác do TradingView cung cấp hoặc xác nhận. Đọc thêm tại Điều khoản Sử dụng.