Probability Staircase Trend Engine [PhenLabs]
📊 Probability Staircase Trend Engine [PhenLabs]
Version: PineScript™ v6
📌 Description
Most trend tools print an arrow and then place targets at fixed 1R, 2R and 3R. They do that no matter how the trend has actually behaved on the symbol and timeframe in front of you. Probability Staircase Trend Engine does something different. It records what happened after every previous trend flip on your chart. Then it places each new target where past flips really got to, and shows how long they took.
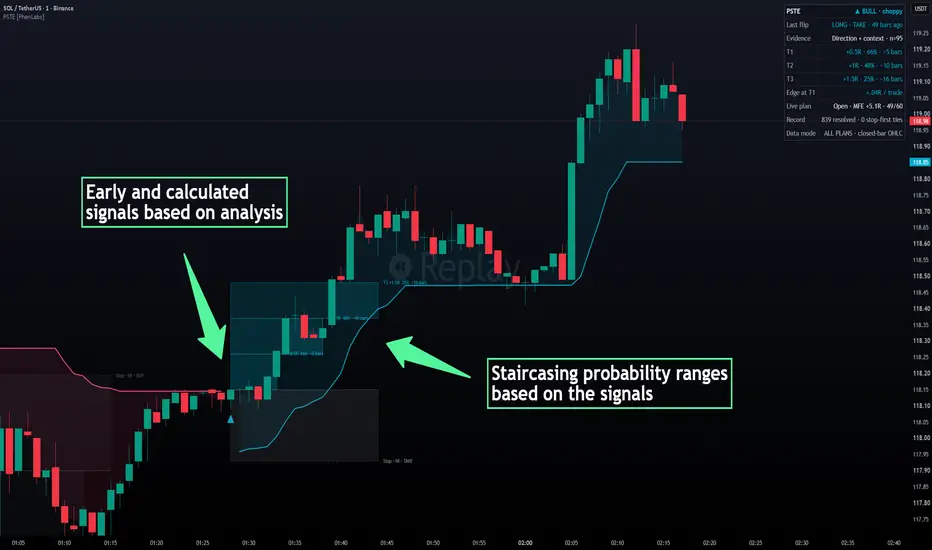
Every confirmed flip becomes a tracked shadow trade with a structural stop. The engine measures how far each one ran in your favor before it was stopped, reversed, or timed out. When a new flip prints, it reads that record for similar flips and draws a staircase of three target boxes. T1 is the furthest level most past flips reached. T2 and T3 are progressively less likely extensions. Each box ends at the typical number of bars it took to get there.
It also gives a plain TAKE or SKIP verdict based on whether a simple "take profit at T1" plan has made money on this chart historically. The trader decision it answers: is this trend flip worth taking, where are the realistic targets, and how long should I give them.
🚀 Points of Innovation
🔧 Core Components
🔥 Key Features
🎨 Visualization
📖 Usage Guidelines
Trend Engine
Calibration
Visuals
✅ Best Use Cases
⚠️ Limitations
💡 What Makes This Unique
⚙️ Under the Hood
🔬 How It Works
Version: PineScript™ v6
📌 Description
Most trend tools print an arrow and then place targets at fixed 1R, 2R and 3R. They do that no matter how the trend has actually behaved on the symbol and timeframe in front of you. Probability Staircase Trend Engine does something different. It records what happened after every previous trend flip on your chart. Then it places each new target where past flips really got to, and shows how long they took.
Every confirmed flip becomes a tracked shadow trade with a structural stop. The engine measures how far each one ran in your favor before it was stopped, reversed, or timed out. When a new flip prints, it reads that record for similar flips and draws a staircase of three target boxes. T1 is the furthest level most past flips reached. T2 and T3 are progressively less likely extensions. Each box ends at the typical number of bars it took to get there.
It also gives a plain TAKE or SKIP verdict based on whether a simple "take profit at T1" plan has made money on this chart historically. The trader decision it answers: is this trend flip worth taking, where are the realistic targets, and how long should I give them.
🚀 Points of Innovation
- Targets come from an excursion survival curve. Each target is the furthest R-level a chosen share of similar past flips actually reached. Fixed R multiples are not used.
- Time-to-target projection: each target box ends at the median number of bars past flips needed to reach that level. The plan shows where and roughly when.
- Path-dependent, stop-first accounting: if a bar touches the stop, that bar's favorable move is never credited. Ambiguous bars are counted and shown openly.
- A TAKE or SKIP verdict based on the realized expectancy of the T1 plan, including every trade that was stopped, reversed, or timed out.
- Context-aware evidence: clean-trend and choppy-trend flips are measured separately. Thin samples fall back to broader pools automatically.
- Self-calibrating on any symbol and timeframe. The same settings adapt to crypto, indices, FX, or stocks because the evidence comes from the chart itself.
🔧 Core Components
- Efficiency-Adaptive Trend Trail: a Kaufman-efficiency adaptive baseline with an ATR trailing band that ratchets in the trend direction. A close through the trail on a confirmed bar is the flip.
- Shadow-Trade Tracker: every flip, taken or skipped, opens a hypothetical trade with a swing-based stop clamped between 0.5 and 3 ATR. It is tracked bar by bar until it is stopped, reversed, or reaches the horizon.
- Outcome Ring Buffer: the last 300 resolved flips are stored with direction, trend context, maximum favorable excursion in R, exit result, and the bar count at which each R-level was first reached.
- Survival Ladder: at each new flip, the share of similar past flips that reached 0.5R, 1R, 1.5R, 2R, 2.5R, 3R, 4R and 5R is computed. T1, T2 and T3 are read off that curve at the chosen probability thresholds.
- Verdict Engine: the average result of "exit at T1, otherwise whatever the trade did" decides TAKE or SKIP. Flips with too little evidence are marked as calibrating.
🔥 Key Features
- One clean trade plan per flip: entry, stop zone and three probability-weighted targets, with nothing else on price.
- Every target label shows its R-multiple, how often similar flips reached it, and the typical bars needed.
- Resolved plans freeze at their exit bar with a check mark on every target that was hit, so the chart keeps an honest visual record.
- Three ladder presets (Conservative, Balanced, Aggressive) change how demanding the target probabilities are.
- Non-repainting: signals, plans and statistics only update on closed bars.
- Works fully on every TradingView plan. It uses only closed-bar OHLC data, with no lower-timeframe or tick requirements.
- Four alerts and five Pine Screener columns.
🎨 Visualization
- Trend Trail: a single cyan (bull) or pink (bear) line with a soft fill toward price. It breaks cleanly on each flip.
- Probability Staircase: up to three translucent boxes stepping away from the entry. Fainter boxes mean lower reach probability. Box length is the typical time to reach that level.
- Stop Zone: a grey box from entry to the stop with a dashed border. Its label carries the verdict (TAKE, SKIP or calibrating).
- Signal Markers: small triangles offset from the candles for TAKE flips, grey crosses for SKIP flips, and faded triangles while the engine is still calibrating.
- Past Plans: previous plans fade and stay frozen at their exit bar, with a check mark on reached targets and a cross on stopped plans.
- Dashboard: trend state and context, last flip and verdict, the evidence pool and its size, T1 to T3 with probability and time, edge per trade, live plan progress, record size with stop-first tie count, and the active data mode.
📖 Usage Guidelines
Trend Engine
- Trend Sensitivity — Default: Balanced — Options: Fast, Balanced, Slow — Controls the adaptive baseline and the ATR band width. Fast flips more often and suits intraday charts. Slow produces fewer, longer trends.
- Stop Swing Lookback — Default: 10 — Range: 3-50 — Bars used to find the swing extreme for the stop. Risk is always clamped between 0.5 and 3 ATR.
- Plan Horizon (bars) — Default: 60 — Range: 10-300 — A shadow trade still open after this many bars is closed at the bar's close and recorded.
Calibration
- Minimum Sample — Default: 20 — Range: 8-150 — Resolved flips required before a pool is trusted. Higher values give steadier statistics but need more chart history.
- Target Ladder — Default: Balanced (60 / 40 / 20%) — Options: Conservative (70 / 50 / 30%), Aggressive (50 / 30 / 15%) — Reach probabilities used to place T1, T2 and T3.
- Split by Trend Efficiency — Default: On — Measures clean-trend and choppy-trend flips separately. Turn it off on short histories to pool more evidence.
Visuals
- Show Probability Staircase — Default: On — Draws the trade plan boxes and labels.
- Past Plans Kept — Default: 2 — Range: 0-5 — Frozen plans kept for context. Active only when the staircase is on.
- Show SKIP Flips — Default: On — Grey markers for flips whose evidence was negative.
- Bull / Bear colors — Default: cyan / pink — Chosen to read on both dark and light themes.
- Show Dashboard and Table Size — Default: On / Small — Table Size is active only when the dashboard is on.
✅ Best Use Cases
- Trend traders who want targets grounded in how their market actually trends, not fixed multiples.
- Deciding whether to take or skip a fresh trend flip on a symbol you have not traded before.
- Setting realistic time expectations: exiting a trade that has run far past the typical time to T1.
- Screening a watchlist for fresh TAKE flips with a positive edge.
- Comparing how the same rule behaves across timeframes by switching the chart timeframe and reading the dashboard.
⚠️ Limitations
- Statistics are computed from the history loaded on your chart. They describe how this rule behaved in the past on this symbol and timeframe, and they are not a forecast.
- Plans only appear after enough flips have resolved. Short histories or very high Minimum Sample values keep the engine in calibrating mode for longer.
- OHLC bars do not reveal the order of the high and the low. When a bar touches the stop, the engine assumes the stop came first. This is conservative and can understate results. The dashboard counts how often it happened.
- The shadow trades use the flip close as entry and ignore spreads, commissions and slippage.
- Because the trend engine flips on closed bars, entries are one bar after the move began. The indicator trades early entries for non-repainting signals.
💡 What Makes This Unique
- Measured targets: every target is a probability you can read, taken from the survival curve of past flips on your chart.
- Time dimension: target boxes show how long each level usually takes, which few trade-plan tools attempt.
- Honest bookkeeping: stop-first handling, full inclusion of losing and timed-out trades, and a visible tie counter.
- A verdict with evidence: TAKE or SKIP always comes with the pool it was based on and its sample size.
⚙️ Under the Hood
- Excursion survival inversion: each resolved shadow trade stores its maximum favorable excursion in R, measured only on bars before the stop. At a new flip the engine computes S(g), the share of matching past trades whose excursion reached each grid level g. T1, T2 and T3 are the largest g where S(g) meets the ladder thresholds. This replaces arbitrary target spacing with the instrument's own measured behavior.
- User-defined-type outcome ring buffer: resolved trades live in an array of Outcome objects capped at 300 entries (oldest evicted first). Each holds direction, context bucket, excursion, exit result and first-reach bar counts for eight R-levels. A method with a switch reads the reach time for any level.
- Hierarchical evidence pools: the engine uses the most specific pool with enough samples (same direction and trend context, then same direction, then all flips). The dashboard always shows which pool was used and its size.
- Median time-to-target projection: for each chosen target, array.median over the reach times of trades that got there sets the box's right edge. Boxes are drawn with xloc.bar_index into future bars, capped inside TradingView's 500-bar limit.
- Efficiency-adaptive trail: a Kaufman efficiency ratio drives the baseline speed, and an ATR band ratchets only in the trend direction. The same ratio, compared with its 200-bar median, labels each flip as clean or choppy.
- Plan lifecycle objects: each drawn plan is stored as a Plan object holding its boxes, labels and line. At resolution it is frozen to the exit bar and marked. It is faded when the next plan starts and pruned beyond the kept-plan limit, so object counts stay capped.
- Data mode / plan note: no plan-gated features are used. Everything runs on closed-bar OHLC on every TradingView plan, and the dashboard row reads "ALL PLANS · closed-bar OHLC".
- Screener & alerts: Pine Screener columns are Signal (+1 long TAKE, -1 short TAKE, ±0.5 other flips), Trend State, Edge at T1 (R per trade), T1 Reach Probability (%), and Bars Since Flip. A useful filter is Signal = 1 and Edge at T1 > 0.2. Alerts: Long TAKE, Short TAKE, Long Flip (any verdict), Short Flip (any verdict).
🔬 How It Works
- Detect the flip: on each closed bar the adaptive trail ratchets with the trend. A close through it flips direction and creates a signal.
- Size the risk: the stop goes beyond the recent swing extreme and is clamped between 0.5 and 3 ATR, defining 1R for the plan.
- Read the evidence: the engine selects the most specific pool of similar past flips with enough samples and computes how often each R-level was reached.
- Build the staircase: T1, T2 and T3 are placed on the survival curve. Each box ends at the typical bars-to-reach, and fainter boxes mean lower probability.
- Issue the verdict: if exiting at T1 has had positive average results in this pool, the flip is TAKE. Otherwise it is SKIP.
- Record the outcome: the new flip is tracked as a shadow trade. When it resolves, its result joins the record and the next plan learns from it.
💡 Note:
Give the engine enough history. A few hundred bars with 40 or more resolved flips is a good start, and the dashboard shows exactly how much evidence each plan used. Start with the Balanced presets. Treat SKIP as “this rule has not paid on this chart lately,” not as a signal to trade the other way. Probabilities are descriptive statistics of past behavior on your chart and carry no guarantee. This indicator is an analytical aid for education and research, not financial advice.

TradingView Charting w/ Crypto Systems: phenlabs.com
Join our growing community: discord.gg/phen
All content provided by PhenLabs is for informational & educational purposes only. Past performance does not guarantee future results.
Join our growing community: discord.gg/phen
All content provided by PhenLabs is for informational & educational purposes only. Past performance does not guarantee future results.
Thông báo miễn trừ trách nhiệm
Thông tin và các ấn phẩm này không nhằm mục đích, và không cấu thành, lời khuyên hoặc khuyến nghị về tài chính, đầu tư, giao dịch hay các loại khác do TradingView cung cấp hoặc xác nhận. Đọc thêm tại Điều khoản Sử dụng.
TradingView Charting w/ Crypto Systems: phenlabs.com
Join our growing community: discord.gg/phen
All content provided by PhenLabs is for informational & educational purposes only. Past performance does not guarantee future results.
Join our growing community: discord.gg/phen
All content provided by PhenLabs is for informational & educational purposes only. Past performance does not guarantee future results.
Thông báo miễn trừ trách nhiệm
Thông tin và các ấn phẩm này không nhằm mục đích, và không cấu thành, lời khuyên hoặc khuyến nghị về tài chính, đầu tư, giao dịch hay các loại khác do TradingView cung cấp hoặc xác nhận. Đọc thêm tại Điều khoản Sử dụng.