AG Pro DMI Rotation Pressure [AGPro Series]AG Pro DMI Rotation Pressure
Overview / What it does
AG Pro DMI Rotation Pressure is designed to track directional leadership shifts between +DI and -DI rather than treating DMI as a simple trend-strength confirmation tool. The script focuses on which side is gaining control, how decisively that control is expanding, and whether the current condition reflects rotation, compression, drift, or established directional pressure.
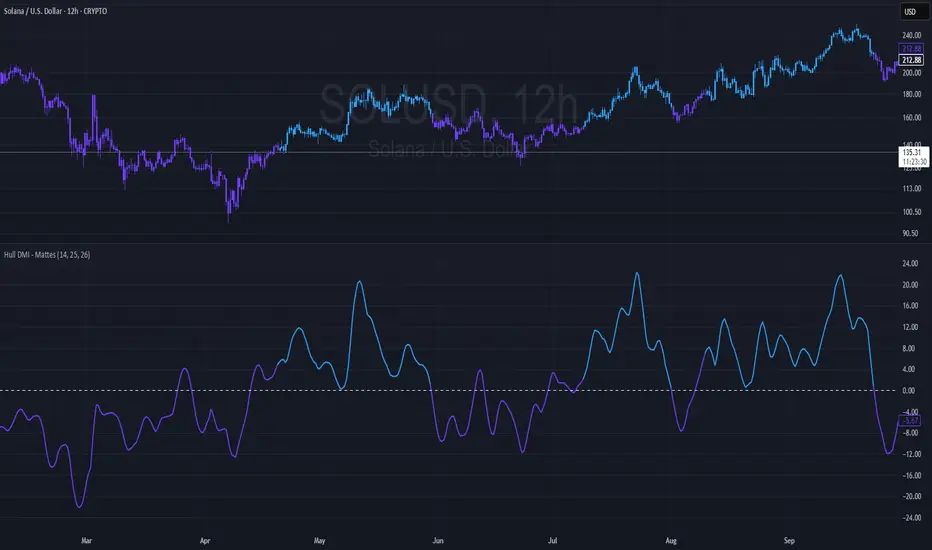
The indicator is plotted in a separate pane so the rotational structure can be read clearly without interfering with price structure on the main chart. It combines a net pressure histogram, a pressure signal line, DI spread behavior, rotation bursts, and compression tension into one framework intended to make directional handoffs easier to interpret.
This script is intentionally different from strength-oriented DMI or ADX studies. In many DMI-based tools, ADX becomes the main story. Here, ADX is only a supporting context value. The primary objective is to monitor the push-and-pull between +DI and -DI, especially when leadership is unstable, when pressure begins to build after compression, or when one side starts to hold directional control more consistently.
For traders who want to study internal directional pressure before or during trend development, this script is built to highlight control transitions rather than just reporting whether a trend is already strong.
Unique Edge
The distinctive feature of this script is its emphasis on rotational pressure instead of trend-strength ranking. Rather than asking only whether the market is strong, it asks which side is taking control, whether that control is improving or fading, and whether a transition is underway.
This produces a different read from a standard ADX workflow. A market can have moderate ADX and still show meaningful bullish or bearish pressure transfer through the behavior of +DI and -DI. Conversely, a market may print elevated ADX while the directional leadership structure is already weakening or becoming unstable. By separating directional leadership from raw strength, the script aims to expose the internal character of the move more clearly.
The script also classifies the environment into readable states such as Bull Rotation, Bear Rotation, Bull Control, Bear Control, Bull Expansion, Bear Expansion, Bull Drift, Bear Drift, and Compression Battle. That state engine is meant to reduce ambiguity and make the pane easier to interpret quickly across multiple symbols and timeframes.
Methodology
The script begins with the DMI framework: +DI, -DI, and ADX. From there, it derives a rotational model built around DI spread and spread behavior over time.
1. DI leadership
The core directional read is the spread between +DI and -DI. Positive spread means bullish directional leadership. Negative spread means bearish directional leadership. The magnitude of that spread is used as one layer of directional pressure assessment.
2. Rotational slope behavior
The script evaluates how +DI and -DI are changing, not only their absolute values. This helps estimate whether one side is accelerating relative to the other. Slope behavior is important because leadership transitions often begin before a large DI spread is fully established.
3. Pressure scoring
Bullish and bearish pressure are scored separately using DI spread, relative slope behavior, and spread momentum. This creates the Bull / Bear pressure readings shown in the panel, as well as the Net Pressure histogram in the pane.
4. Signal smoothing
A pressure signal line is applied to the net pressure series to make pressure drift and bias easier to read. This is not intended as a prediction line. It is a smoothing layer that helps frame whether the dominant side is strengthening, fading, or remaining relatively stable.
5. Rotation bursts
Crossovers between +DI and -DI are treated as potential rotational events. The script scores those events so that rotation markers are tied to directional handoff rather than appearing as purely cosmetic crossover labels.
6. Compression and tension
When DI spread contracts below the compression threshold, the script evaluates internal tension. This is useful because some of the most meaningful directional expansions begin after a compressed and contested leadership state. Compression Battle is meant to identify that contested environment, not to forecast direction by itself.
7. State engine
The script assigns a readable state based on pressure, spread, crossover status, and compression context. This is what allows the study to describe the environment as rotation, control, expansion, drift, or compression instead of leaving the user to infer all conditions from raw lines alone.
Signals & Alerts
The script includes deterministic alert conditions for the following events:
Bull Rotation
Triggered when +DI crosses above -DI and bullish directional rotation takes control.
Bear Rotation
Triggered when +DI crosses below -DI and bearish directional rotation takes control.
Bull Control
Triggered when bullish pressure is in control territory.
Bear Control
Triggered when bearish pressure is in control territory.
Compression Battle
Triggered when DI spread is compressed while internal tension is elevated.
These conditions are designed to describe state changes inside the DMI structure. They should be used as analytical events, not as automatic trade instructions.
Key Inputs
DI Length
Controls the base DMI sensitivity.
ADX Smoothing
Adjusts the ADX smoothing component used for contextual strength reading.
Rotation Slope Smoothing
Changes how quickly slope-based rotational behavior reacts.
Pressure Signal Length
Controls smoothing of the net pressure signal.
Compression Threshold
Defines when DI spread is considered compressed.
Expansion Threshold
Defines when directional pressure begins to qualify as expansion.
Control Threshold
Defines when directional pressure is strong enough to be treated as control.
Visual controls
Backgrounds, spread fill, rotation markers, panel theme, panel position, and panel font size can all be adjusted depending on the chart style and workspace preference.
Limitations & Transparency
This script is not a forecasting model. It does not know future direction and it does not attempt to predict exact reversal points. It is a structural pressure tool built from DMI behavior.
Like all DMI-based studies, it can become noisy in highly erratic or mean-reverting conditions. Repeated +DI and -DI handoffs may appear during choppy phases, especially on lower timeframes or during indecisive sessions.
Compression readings should not be interpreted as guaranteed breakout setups. Compression only describes a tight directional contest inside the DI structure. Direction still needs confirmation from price behavior, market structure, volatility regime, or other contextual tools.
Bullish or bearish control states do not guarantee continuation. They only indicate that the directional pressure model currently favors one side. Users should evaluate the output alongside price structure, support/resistance, volume behavior, and timeframe context.
This study is best treated as a directional pressure map, not as a standalone trading system.
Risk Disclosure
This script is for chart analysis and research purposes only. It does not provide financial, investment, or trading advice. Markets involve risk, and indicator-based decisions can result in losses. Always use independent judgment, confirm with broader market context, and apply appropriate risk management.
Chỉ báo