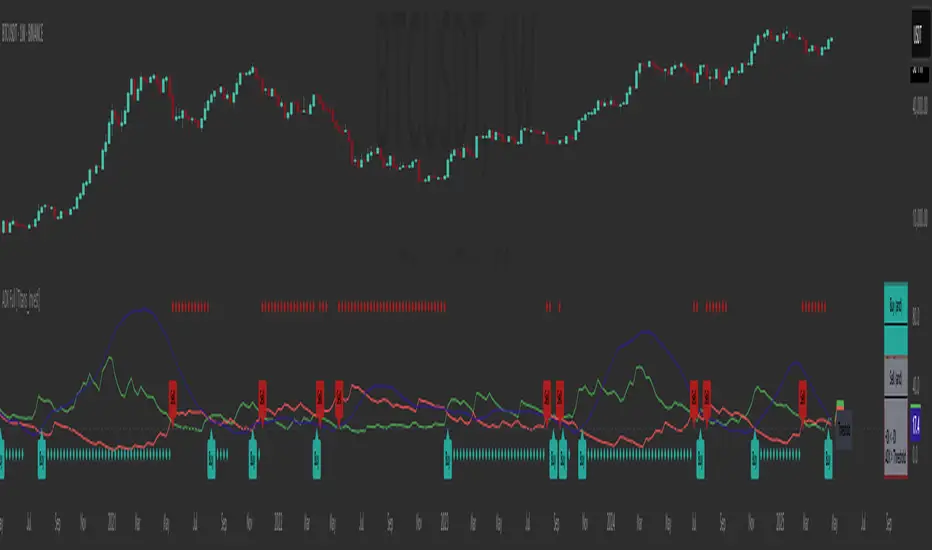
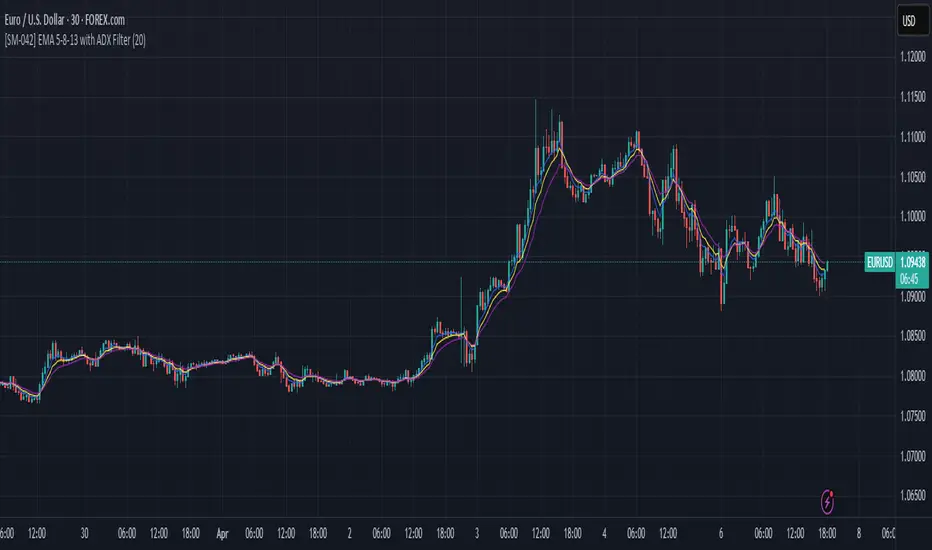
DNSE VN301!, ADX Momentum StrategyA statistical momentum breakout strategy for VN30F1M futures. Rather than fixed thresholds, it measures how unusual current momentum and price behavior are relative to their own recent history, using the IQR (Interquartile Range) as a dynamic, self-adjusting boundary, visible directly on the indicator panel as the strategy runs.
________________________________________________________________
1. Component breakdown: ADX, +DI, -DI, and the DI Acc Change IQR
The Directional Movement System (ADX/+DI/-DI) measures buying pressure vs. selling pressure:
+DI rises when today's close is higher than yesterday's, tracking the strength of upward pressure.
-DI rises when today's close is lower than yesterday's, tracking the strength of downward pressure.
ADX is derived from how far apart +DI and -DI are, measuring trend strength regardless of direction. In this script ADX is plotted for reference only and is not used as a trade filter; the signal logic runs entirely on +DI and -DI individually.
The strategy does not trade on +DI/-DI directly, it trades on how fast they are changing, built up in two steps:
- Slope equals DI minus its own EMA(10), a 1st-derivative proxy showing whether DI is currently running above or below its short-term trend.
- Acceleration equals Slope minus the EMA(10) of that slope, a 2nd-derivative proxy showing whether the slope itself is speeding up or slowing down.
Acceleration Change equals today's acceleration minus yesterday's, and this is the actual number compared against the threshold, calculated separately for +DI and -DI.
This is where the IQR table's "DI Acc Change (IQR)" row comes from.
The script takes the last 1,000 bars of +DI Acceleration Change and -DI Acceleration Change and calculates the IQR (25th-to-75th percentile spread) of each series independently, shown as the "+DI Acc Change" and "-DI Acc Change" columns. These two are then averaged into "Avg IQR," which is the single number a live acceleration-change reading must exceed to count as a breakout. In other words, ADX/DI tells you pressure exists, slope tells you its trend, acceleration tells you if that trend is speeding up, and the DI Acc Change IQR tells you whether today's speed-up is statistically large enough to matter.
________________________________________________________________
2. Component breakdown: what IQR is and the Close Gap IQR
IQR (Interquartile Range) is a standard statistical measure of typical spread in a dataset. Sort the data, find the value at the 25th percentile (Q1) and the value at the 75th percentile (Q3), and take the difference (Q3 minus Q1). This deliberately excludes the top and bottom 25% of the data, the extreme values, before measuring spread. IQR stays anchored to what normal bars look like, regardless of how extreme a handful of recent bars have been.
The script applies this same IQR calculation to a second, separate series: Close Bar Gap (current's bar close minus last bar's close), over the last 250 bars. That gives Close Gap Q1 and Close Gap Q3, and their difference is the "Close Gap (IQR)" row in the table, shown as one repeated value across all three columns since, unlike DI, there's only one gap series rather than one split by direction. A reading of 8.6, for example, means a single bar's close-to-close move needs to exceed 8.6 points to be considered volatile rather than routine.
________________________________________________________________
(3). How to read the IQR Table and use this strategy:
Exit filter: an exit is only considered when the current bar's close gap itself exceeds this IQR value, meaning the market is currently making an unusually large move rather than just drifting.
Stop-loss distance: when a stop-loss is armed, it's placed exactly Close Gap IQR points away from the entry price, rather than a fixed point value. In calm markets this value shrinks and the stop tightens; in volatile markets it expands and the stop widens automatically.
How to read the chart, step by step:
This table shows the current statistical thresholds the strategy is measuring every bar against. The DI Acc Change (IQR) row shows the normal range of momentum acceleration change, split into +DI and -DI, averaged into Avg IQR. A reading such as +DI 2.39, -DI 1.98, Avg 2.18 means that, on average, day-to-day acceleration changes larger than about 2.18 are statistically unusual.
The Close Gap (IQR) row shows the normal range of bar-to-bar close price movement, for example 8.6, where moves larger than this are considered volatility spikes. These two numbers are the actual trigger levels for that moment, updating continuously as new bars form, so they will not stay fixed at the value shown at any one time.
Next, watch the oscillator panel for the breakout signal. The purple flat line is the current Average DI IQR threshold, and the green flat line is the current Close Gap IQR threshold, the same numbers as the table, drawn so live price and momentum lines can be seen interacting with them. The yellow line (+DI Acceleration Change) and orange line (-DI Acceleration Change) are the momentum signal; when either spikes above the purple line, momentum has broken out of its normal range, which is the entry trigger. The blue and red lines above them are the raw +DI/-DI Acceleration values, showing the trend of momentum rather than the breakout trigger itself, useful for seeing which direction pressure is building before a spike happens.
Then confirm direction on the price panel. A DI breakout alone doesn't say which way to trade, so the strategy also checks whether the current bar closed higher or lower than the previous one. A breakout with a higher close signals Long; a breakout with a lower close signals Short. The arrows on the price panel mark exactly where both conditions lined up.
Watch the white line for exit and stop conditions. The white line (Close Bar Gap) is the raw bar-to-bar price movement. When it spikes past the green Close Gap IQR line, that bar's price move is itself abnormal, and combined with RSI turning against the position and a DI breakout still active, this arms a stop-loss sized to the current Close Gap IQR value rather than a fixed number.
Finally, RSI, plotted as the purple line in the price-panel oscillator, confirms fade rather than entry. RSI is only used at exit, rising or falling relative to the prior bar, to confirm momentum is actually fading on the side the position is on, rather than duplicating the entry signal.
In short: the table numbers are today's thresholds. The yellow or orange line crossing the purple line is a momentum breakout and the entry trigger. Price direction determines which side to trade. The white line crossing the green line, combined with RSI turning and a still-active breakout, arms the stop-loss, sized to the current Close Gap IQR rather than a fixed point value.
________________________________________________________________
4. Strategy settings and configuration:
Chart timeframe: recommended 30-minute
Position size: 4 contracts
Initial capital: 100,000,000 VND
Commission: 5,250 VND per contract, excluding tax
Slippage: 3 ticks
ADX / DI length: 14
RSI length: 14
DI slope/acceleration smoothing: 10
DI acceleration IQR lookback: 1,000 bars
Close gap IQR lookback: 250 bars
Stop loss: dynamic, sized to Close Gap IQR
Take profit: disabled
Trading session: 09:00–11:30, 13:00–14:30
End-of-day auto close: 14:30
Long entry — all of the following must be true:
in trading session
+DI acceleration change ≥ Avg DI IQR OR -DI acceleration change ≥ Avg DI IQR
close > previous close
no open position
Long exit — reversal:
close Long immediately if Short entry conditions become true
Long exit — stop-loss arms when all of the following are true:
in trading session
+DI acceleration change ≥ Avg DI IQR OR -DI acceleration change ≥ Avg DI IQR
RSI < previous RSI
close gap ≥ Close Gap IQR
close < previous close
stop level = entry price − Close Gap IQR
Short entry — all of the following must be true:
in trading session
+DI acceleration change ≥ Avg DI IQR OR -DI acceleration change ≥ Avg DI IQR
close < previous close
no open position
Short exit — reversal:
close Short immediately if Long entry conditions become true
Short exit — stop-loss arms when all of the following are true:
in trading session
+DI acceleration change ≥ Avg DI IQR OR -DI acceleration change ≥ Avg DI IQR
RSI > previous RSI
close gap ≥ Close Gap IQR
close > previous close
stop level = entry price + Close Gap IQR
All positions force-close at 14:30, overriding every other condition.
----------------------------------
*Figure examples, using table values Avg DI IQR = 2.18 and Close Gap IQR = 8.6:
Both IQR values recalculate every bar from a rolling 1,000-bar window (DI) and 250-bar window (close gap), so the 2.18 and 8.6 figures above are illustrative snapshots, not fixed constants.
Long entry example: +DI acceleration change reads 2.7, above the 2.18 threshold. Close prints 1,642.0 versus a prior close of 1,639.5. Both conditions true with no open position, so Long opens at 1,642.0.
Long exit example: while Long is open, a bar shows a breakout still active, RSI falling from the prior bar, a close gap of 9.1 points which exceeds 8.6, and close at 1,633.0 below the prior close. Stop arms at 1,642.0 − 8.6 = 1,633.4.
Short entry example: -DI acceleration change reads 2.5, above the 2.18 threshold. Close prints 1,636.0 versus a prior close of 1,639.5. Short opens at 1,636.0.
Short exit example: while Short is open, a bar shows a breakout still active, RSI rising from the prior bar, a close gap of 8.9 points which exceeds 8.6, and close at 1,644.9 above the prior close. Stop arms at 1,636.0 + 8.6 = 1,644.6.
Risk disclaimer:
Futures trading involves a high level of risk and prices can move sharply. This script is provided for reference, research, and backtesting purposes only. Users should fully understand derivatives trading, their own risk tolerance, and the strategy logic before applying it to live trading.
All investment decisions are the responsibility of the user. This strategy is not responsible for any losses arising from its use in real trading. Past performance does not guarantee future results.
Chiến lược