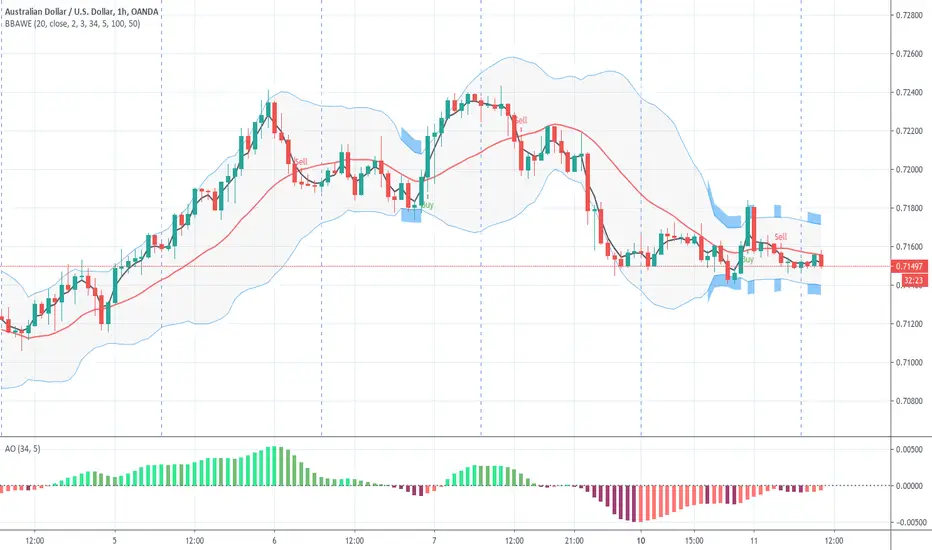
BB+AO ALERTSto be used with AO indicator, based on forex strat -- www.forexstrategiesresources.com works on 1/3/5/15/30 candles, buy signals are best when the black 3 fast ema crosses up through the red mid bandChỉ báocủa jmtizzle33413
BB+AO STRATto be used with AO, based on forex strat -- www.forexstrategiesresources.com works on 1/3/5/15/30 candlesChiến lượccủa jmtizzle11317
Awesome Oscillator with AntiStep CorrectionHere is the well-known Awesome Oscillator (AO), which I use to present the real purpose of this post: a function that provides step correction for simple moving averages (SMAs). We all know that any indicator based on moving averages lags real-time movement. Normally this is fine, but just after large ("step") changes in level, the pre-step values that are still within the SMA window cause the result to falsely reflect continued movement, even when real-time values remain flat. To counter this, when a step change of a configurable size is detected, I temporarily shrink the SMA window size to include only those values occurring since the step change, and then allow the size to increase to normal length as we move away from the step change. This is accomplished within the antistep_sma() function. Note that this will cause SMAs of different lengths (e.g. those used in the AO) to be temporarily equal, until the shorter of the two reaches its normal size and begins to leave the longer one behind again. You can see this above, where the AO, which is the difference of two SMAs, goes to 0 immediately after a sufficiently large step change--configured to 0.5% in this case.Chỉ báocủa LemrinCập nhật 22410
Awesome Oscillator and MACD HistogramThis is a quick script that combines two standard indicators, the Awesome Oscillator and MACD histogram, to highlight the beginnings of periods of fast price movement (divergence between the two). Since MACD's EMA responds more quickly than AO's SMA, look for periods of green over gold as a bullish signal, and red under blue as a bearish signal. Of course both indicators are lagging in nature, but the presence of this divergence often leads larger, continued movement in the same direction. Bullish Signals Change from red to green below 0 with either blue or gold above 0 (strengthened on second green bar): Rising green above 0 with gold below 0: Bearish Signals Change from green to red above 0 with either blue or gold below 0 (strengthened on second red bar): Deepening red below 0 with blue above 0: Chỉ báocủa Lemrin1313 1.1 K
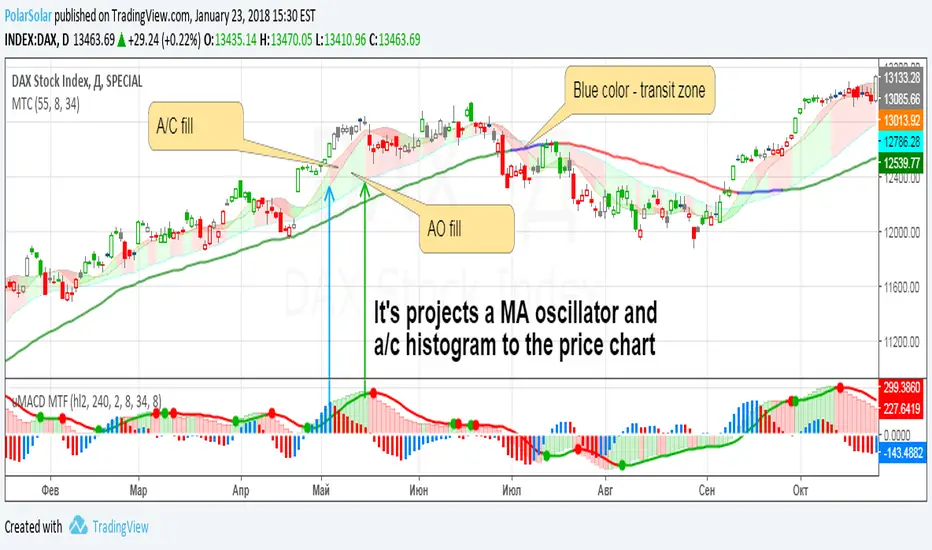
Modern Trade ChaosIt's projects a MA oscillator and a/c histogram to the price chartChỉ báocủa PolarSolar1212668
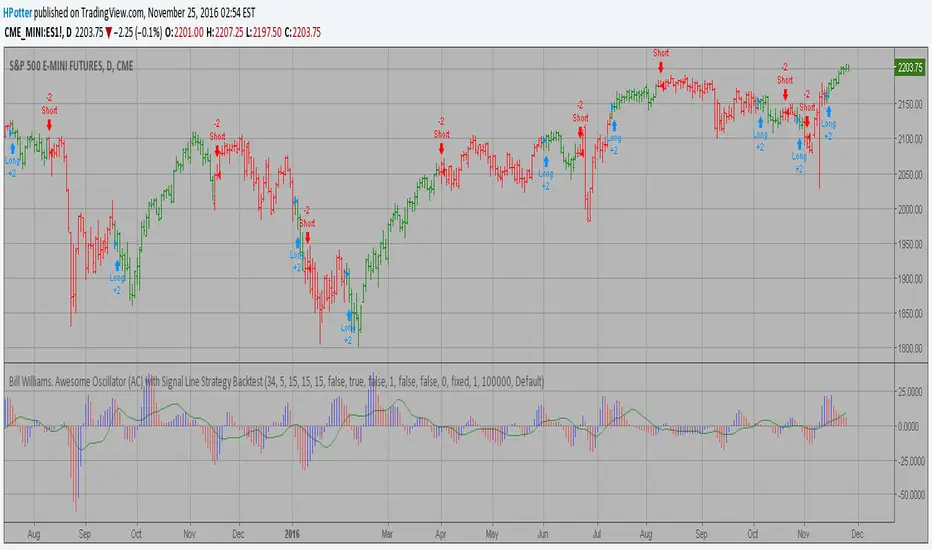
Accelerator Oscillator (AC) Strategy The Accelerator Oscillator has been developed by Bill Williams as the development of the Awesome Oscillator. It represents the difference between the Awesome Oscillator and the 5-period moving average, and as such it shows the speed of change of the Awesome Oscillator, which can be useful to find trend reversals before the Awesome Oscillator does.Chỉ báocủa HPotter328
Bollinger Awesome Alert R1 by JustUncleLThis indicator is an implementation of the Bollinger Band and Awesome Oscillator Scalping system. This technique is for those who want the most simple method that is very effective. It is BEST traded during the busiest trading hours, 3am to 12am EST NY time. This method doesn't work in sideways markets, only in volatile trending markets. Time Frames: 1, 5, 10, 15 ,30 min. Currency pairs: majors. Other Chart indicators: Add Awesome Oscillator. Optionally Add Squeeze Indicator. Here's the strategy: Going LONG: Enter a long position when the black 3 EMA has crossed up through the Bollinger red middle band MA. At the same time, the Awesome should be approaching or crossing it's zeroline, going up. This is indicated by "Buy" alert. Going SHORT: Enter a short position when the black 3 EMA has crossed down through the Bollinger red middle band MA. At the same time, the Awesome should be approaching or crossing it's zero line, going down. This is indicated by the "Sell" Alert. Take profit: 10-20 pips depending on pair or When Awesome Oscillator turns a different colour. HINTS: Best trades tend to occur when price reversing bounce off outer band and outside the Optional Bollinger Squeeze indication. Chỉ báocủa JustUncleLCập nhật 8282 12.6 K
Bill Williams. Awesome Oscillator (AO) Backtest This indicator is based on Bill Williams` recommendations from his book "New Trading Dimensions". We recommend this book to you as most useful reading. The wisdom, technical expertise, and skillful teaching style of Williams make it a truly revolutionary-level source. A must-have new book for stock and commodity traders. The 1st 2 chapters are somewhat of ramble where the author describes the "metaphysics" of trading. Still some good ideas are offered. The book references chaos theory, and leaves it up to the reader to believe whether "supercomputers" were used in formulating the various trading methods (the author wants to come across as an applied mathemetician, but he sure looks like a stock trader). There isn't any obvious connection with Chaos Theory - despite of the weak link between the title and content, the trading methodologies do work. Most readers think the author's systems to be a perfect filter and trigger for a short term trading system. He states a goal of 10%/month, but when these filters & axioms are correctly combined with a good momentum system, much more is a probable result. There's better written & more informative books out there for less money, but this author does have the "Holy Grail" of stock trading. A set of filters, axioms, and methods which are the "missing link" for any trading system which is based upon conventional indicators. This indicator plots the oscillator as a histogram where periods fit for buying are marked as blue, and periods fit for selling as red. If the current value of AC (Awesome Oscillator) is over the previous, the period is deemed fit for buying and the indicator is marked blue. If the AC values is not over the previous, the period is deemed fir for selling and the indicator is marked red. You can change long to short in the Input Settings Please, use it only for learning or paper trading. Do not for real trading.Chiến lượccủa HPotter 1 K
Bill Williams. Awesome Oscillator (AC) Backtest This indicator plots the oscillator as a histogram where blue denotes periods suited for buying and red . for selling. If the current value of AO (Awesome Oscillator) is above previous, the period is considered suited for buying and the period is marked blue. If the AO value is not above previous, the period is considered suited for selling and the indicator marks it as red. You can change long to short in the Input Settings Please, use it only for learning or paper trading. Do not for real trading.Chiến lượccủa HPotter166
Bill Williams. Awesome Oscillator (AC) Strategy Backtest This indicator plots the oscillator as a histogram where blue denotes periods suited for buying and red . for selling. If the current value of AO (Awesome Oscillator) is above previous, the period is considered suited for buying and the period is marked blue. If the AO value is not above previous, the period is considered suited for selling and the indicator marks it as red. You can make changes in the property for set calculating strategy MA, EMA, WMA Please, use it only for learning or paper trading. Do not for real trading. Chiến lượccủa HPotter22367
Bill Williams. Awesome Oscillator (AC) Signal Line This indicator plots the oscillator as a histogram where blue denotes periods suited for buying and red . for selling. If the current value of AO (Awesome Oscillator) is above previous, the period is considered suited for buying and the period is marked blue. If the AO value is not above previous, the period is considered suited for selling and the indicator marks it as red.Chỉ báocủa HPotter44430
Bill Williams. Awesome Oscillator (AO) Signal Line This indicator is based on Bill Williams` recommendations from his book "New Trading Dimensions". We recommend this book to you as most useful reading. The wisdom, technical expertise, and skillful teaching style of Williams make it a truly revolutionary-level source. A must-have new book for stock and commodity traders. The 1st 2 chapters are somewhat of ramble where the author describes the "metaphysics" of trading. Still some good ideas are offered. The book references chaos theory, and leaves it up to the reader to believe whether "supercomputers" were used in formulating the various trading methods (the author wants to come across as an applied mathemetician, but he sure looks like a stock trader). There isn't any obvious connection with Chaos Theory - despite of the weak link between the title and content, the trading methodologies do work. Most readers think the author's systems to be a perfect filter and trigger for a short term trading system. He states a goal of 10%/month, but when these filters & axioms are correctly combined with a good momentum system, much more is a probable result. There's better written & more informative books out there for less money, but this author does have the "Holy Grail" of stock trading. A set of filters, axioms, and methods which are the "missing link" for any trading system which is based upon conventional indicators. This indicator plots the oscillator as a histogram where periods fit for buying are marked as blue, and periods fit for selling as red. If the current value of AC (Awesome Oscillator) is over the previous, the period is deemed fit for buying and the indicator is marked blue. If the AC values is not over the previous, the period is deemed fir for selling and the indicator is marked red.Chỉ báocủa HPotter1818 3.2 K